Charts
See stock financial trends without digging through tabs.
Raw financial statements can be overwhelming to read in tabular form. Chartloom turns decades of financial data into 100+ clear, interactive charts. Track revenue growth, profit margin expansion, Free Cash Flow, valuation multiples, and share dilution across 1Y, 5Y, 10Y, and 35+ year annual timelines, plus up to 15 years of quarterly data.
Free on 5,000+ US stocks · No signup or credit card required
- Spot long-term structural trends
- 100+ fundamental charts
- Annual, Quarterly & TTM views


5,000+
US Stocks
100+
Charts & Research Tools
35+ Years
Annual history · 15Y quarterly
See 15 years of quarterly financials in charts
Chartloom charts up to 15 years of quarterly financial data and 35+ years of annual data for covered US-listed stocks. Switch between Quarterly, Annual, and TTM so you can spot seasonal patterns and long-term trends without digging through filings.
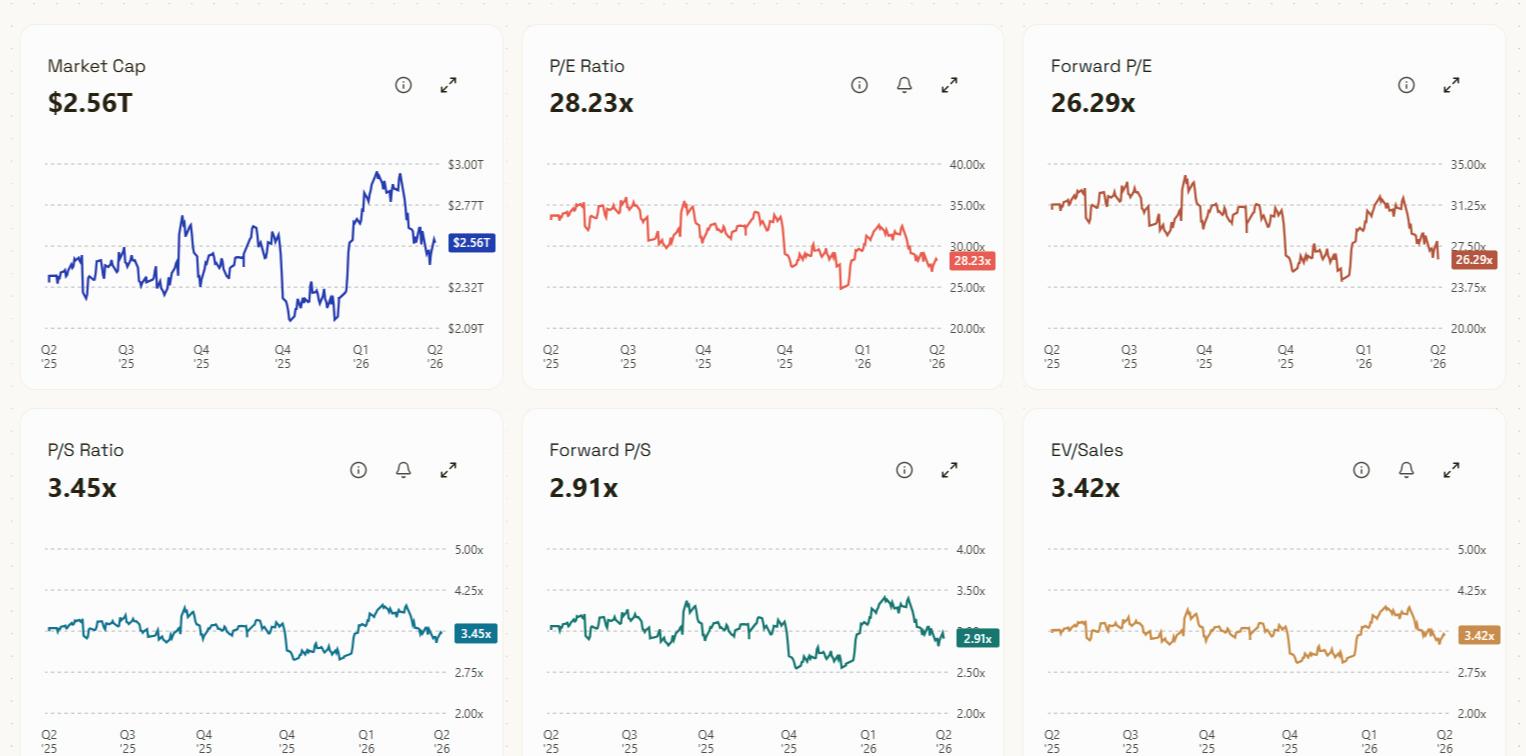
- Revenue, margins, Free Cash Flow, and valuation multiples in interactive charts
- Quarterly history back 15 years (not only annual)
- Peer overlays on the same chart for side-by-side comparison
How to analyze US stock financials with interactive charts
Search a US ticker, open Charts, switch Quarterly, Annual, or TTM, overlay peers on the same chart, then continue into AI SEC filing summaries or Scenario Lab for bull, base, and bear modelling.
Research value
From complex financial statements to clear, interactive charts.
Built for investors who want the important context first: what changed, where the numbers are moving, and which follow-up questions deserve deeper research.
Spot long-term structural trends
See immediately whether a company's profit margins, cash generation, or returns on invested capital are expanding or deteriorating over time.
100+ fundamental charts
Visualize income statements, balance sheets, cash flows, valuation multiples (P/E, P/S, EV/EBITDA, P/FCF), and efficiency ratios.
Annual, Quarterly & TTM views
Switch between annual statements, 15 years of quarterly filings, and Trailing Twelve Months (TTM) views for seasonal and trend clarity.
Direct competitor overlays
Plot a competitor directly on the same chart to compare relative revenue growth, margins, and valuation spreads side by side.
Try Charts with a 14-day free Pro trial
Free plan available · No credit card required · Instant access to 5,000+ US stocks
Benefits
What Charts helps with
Practical research jobs: move faster, keep context together, and decide what deserves deeper analysis.
Spot long-term structural trends
See immediately whether a company's profit margins, cash generation, or returns on invested capital are expanding or deteriorating over time.
100+ fundamental charts
Visualize income statements, balance sheets, cash flows, valuation multiples (P/E, P/S, EV/EBITDA, P/FCF), and efficiency ratios.
Annual, Quarterly & TTM views
Switch between annual statements, 15 years of quarterly filings, and Trailing Twelve Months (TTM) views for seasonal and trend clarity.
Direct competitor overlays
Plot a competitor directly on the same chart to compare relative revenue growth, margins, and valuation spreads side by side.
Built-in metric explanations
Open plain-English knowledge popups explaining how metrics like ROIC, Free Cash Flow Yield, or Rule of 40 are calculated and read.
High-resolution PNG export
Export charts with customized titles, dark/light themes, and legends for research writeups and presentations.
Workflow
How to use it in research
Start with a ticker, use the feature for the specific research job, then jump into the next Chartloom view when more context is needed.
Search a ticker
Open any company and click into the Charts tab to access over 100 fundamental visualizers.
Select timeline and granularity
Switch between Quarterly (up to 15 years), Annual, and TTM views across 1Y, 3Y, 5Y, 10Y, or complete 35+ year annual history.
Compare, learn, or export
Overlay a peer ticker, read metric definitions, set valuation alerts, or export a publication-ready PNG.

Product view
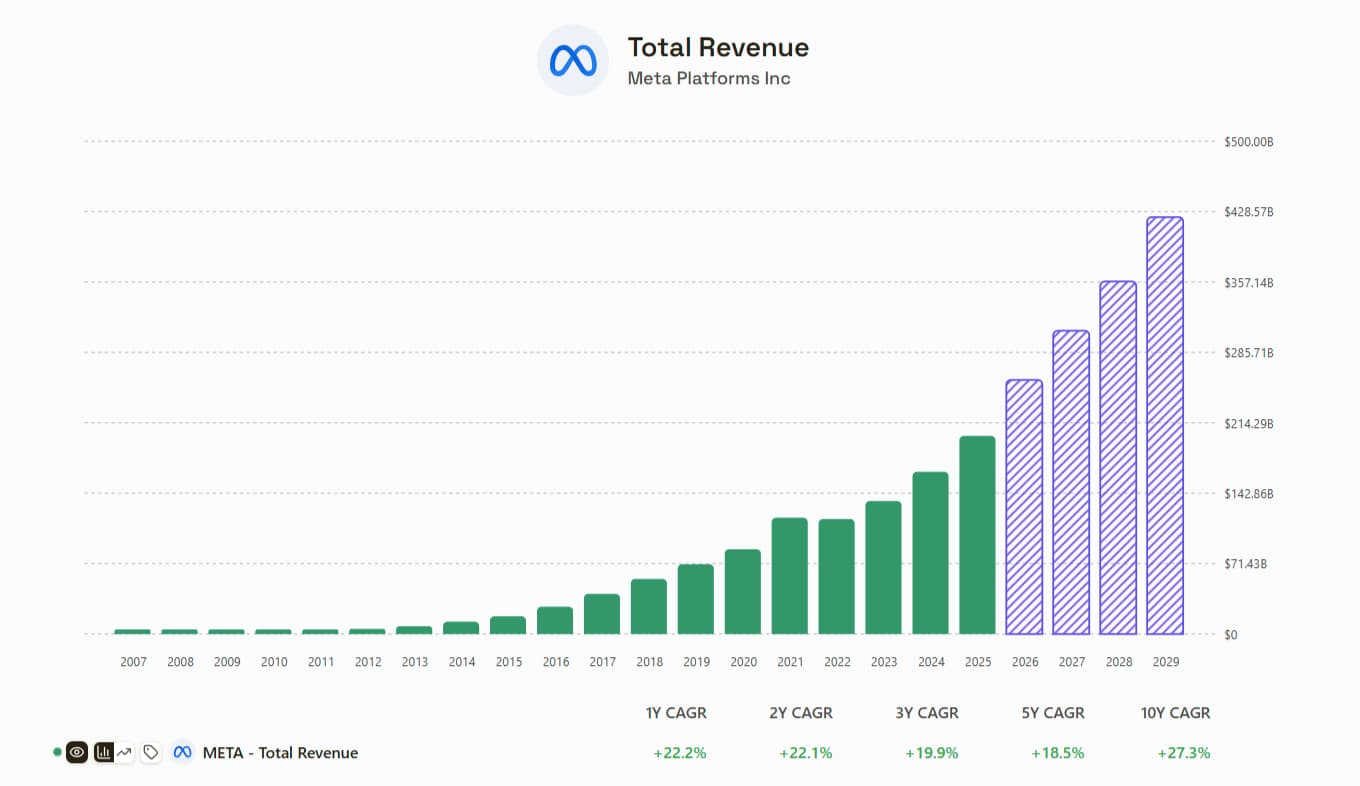
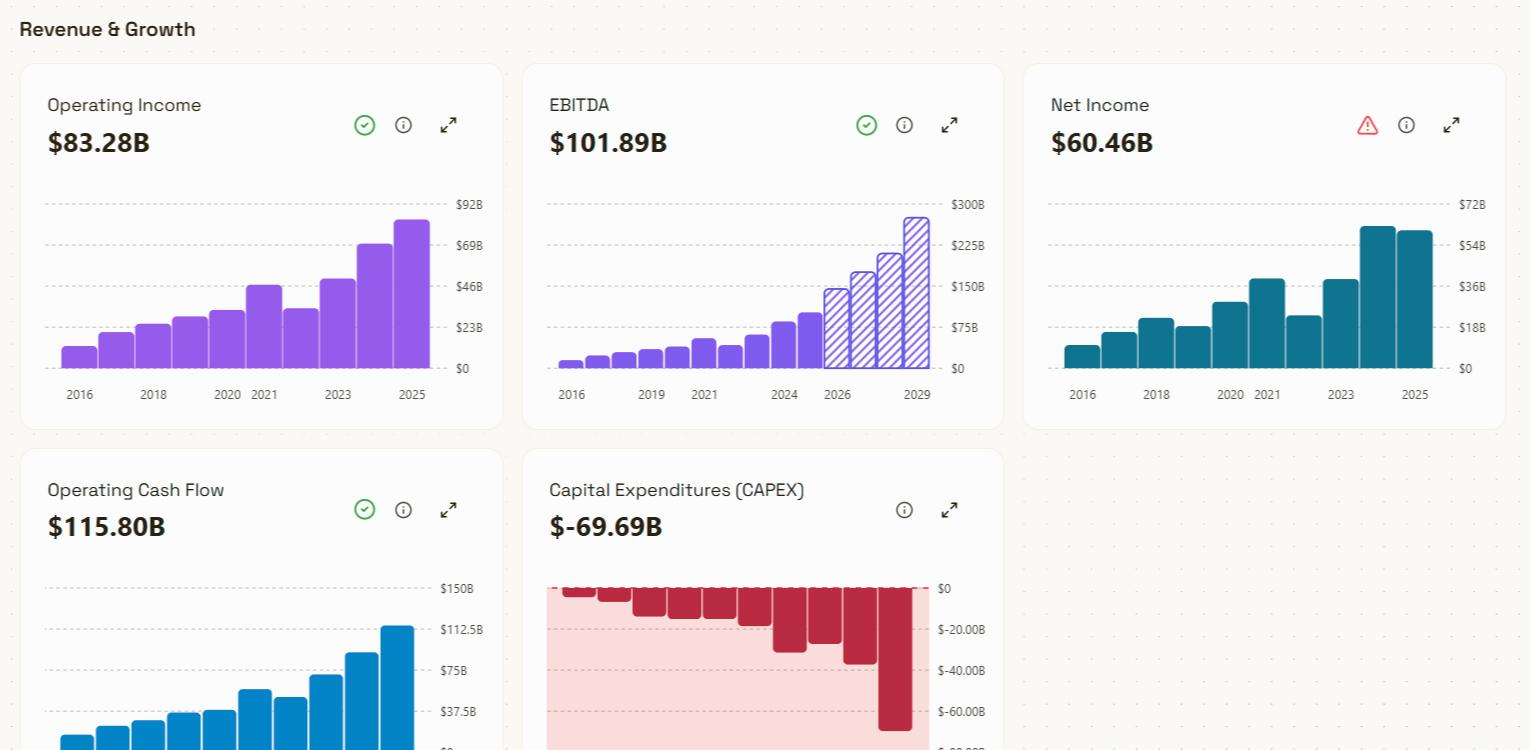
Charts that make company trends easier to read
Use charts to review valuation, growth, margins, cash flow, dividends, and balance sheet trends. Add comparison tickers, switch timelines, open metric explanations, export PNGs, and set valuation alerts where needed.

FAQ
Frequently asked questions
Useful details about Charts, data coverage, and how the feature fits into a research workflow.
What financial and valuation charts can I view in Chartloom?
Chartloom offers over 100 fundamental charts covering revenue, gross/operating/net margins, EPS, Free Cash Flow, capital expenditures, debt-to-equity, shares outstanding, Return on Invested Capital (ROIC), and valuation multiples (P/E, EV/EBITDA, P/S, FCF Yield).
Can I overlay two stocks on the same chart?
Yes. You can add comparison tickers to charts to benchmark revenue growth, gross margins, valuation multiples, and price performance on the same visual timeline.
Can I export stock charts as PNG images?
Yes. All charts can be exported as high-resolution PNG images with customizable titles, legends, and styling, ready for investment memos or sharing online.
Do the charts explain what each financial metric means?
Yes. Every chart includes an educational summary and knowledge popup explaining the formula, significance, and how investors typically interpret the data.
How far back does historical financial chart data go?
Chartloom provides up to 35+ years of historical annual financial data and up to 15 years of quarterly financial data for covered US-listed companies. Switch timeline and granularity (Quarterly, Annual, TTM) in Charts.