Manual Stock Portfolio Tracker · No Broker Login
Track Your Stock Portfolio, Dividends, and DCA Without Broker Logins
Spreadsheets break when you log repeat buys, and many portfolio trackers ask for your brokerage password. Enter US stock positions manually to track weighted cost basis, dollar-cost averaging (DCA), sector weights, and dividend income in one private view.
Free forever for 1 portfolio (up to 15 holdings) · No broker login or card
- Track without broker logins
- Real-time gains & allocation
- Automated DCA performance


5,000+
US Stocks
100+
Charts & Research Tools
35+ Years
Financial History
Research value
From fragile spreadsheets to one private portfolio view
Built for investors who want the important context first: what changed, where the numbers are moving, and which follow-up questions deserve deeper research.
Track without broker logins
Add positions manually with ticker, buy price, share count, and date. Keep credentials private with zero third-party broker links required.
Real-time gains & allocation
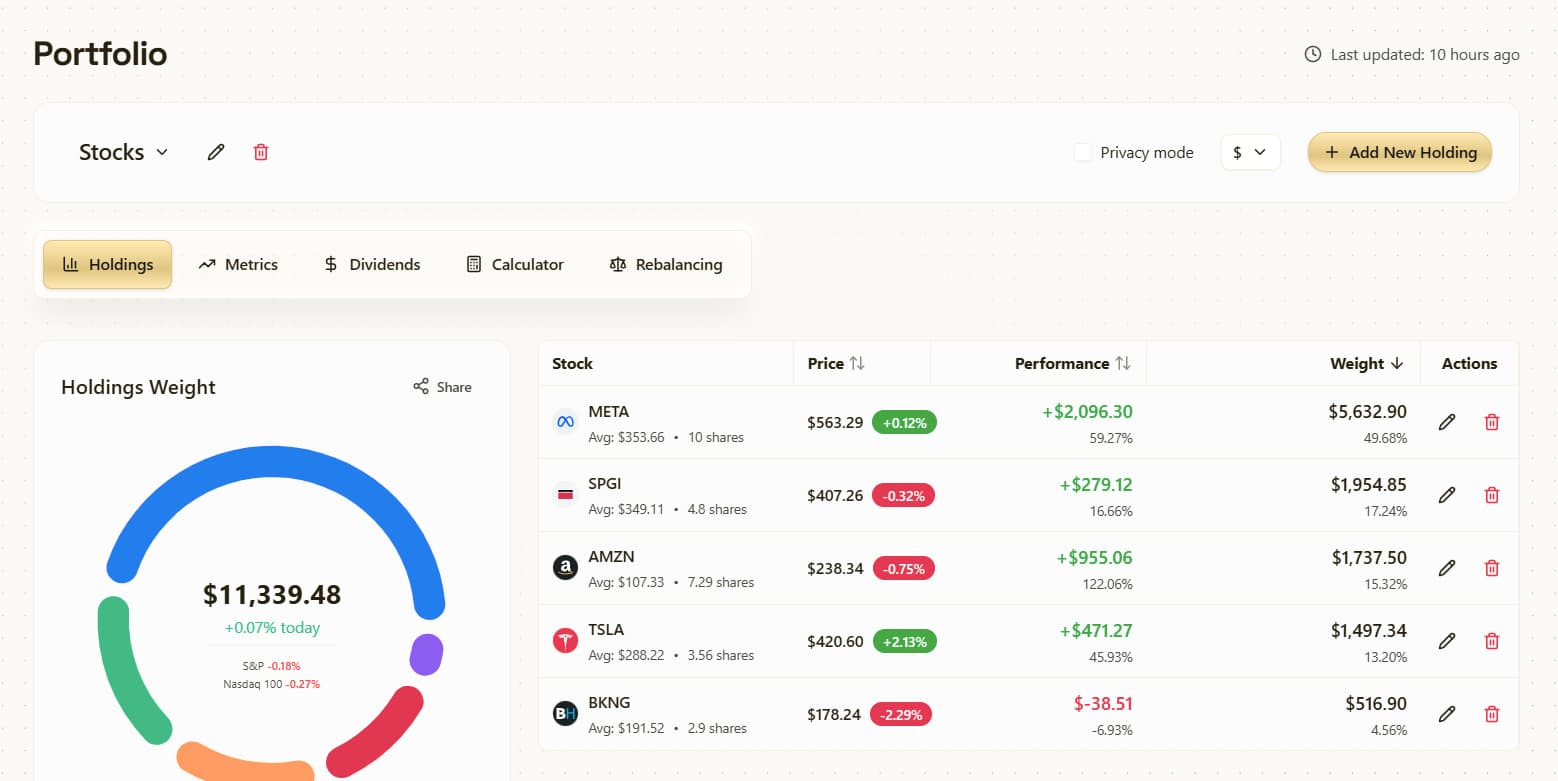
Review total portfolio value, unrealized profit/loss, daily return, and visual sector allocations in one organized table.
Automated DCA performance
Track dollar-cost averaging entries over time to calculate true cost basis evolution without building custom spreadsheet formulas.
Dividend income tracking
Monitor historical dividend payouts and projected annual cash flow across your dividend-paying holdings.
Try Portfolio with a 14-day free Pro trial
Free plan available · No credit card required · Instant access to 5,000+ US stocks
Benefits
What Portfolio helps with
Practical research jobs: move faster, keep context together, and decide what deserves deeper analysis.
Track without broker logins
Add positions manually with ticker, buy price, share count, and date. Keep credentials private with zero third-party broker links required.
Real-time gains & allocation
Review total portfolio value, unrealized profit/loss, daily return, and visual sector allocations in one organized table.
Automated DCA performance
Track dollar-cost averaging entries over time to calculate true cost basis evolution without building custom spreadsheet formulas.
Dividend income tracking
Monitor historical dividend payouts and projected annual cash flow across your dividend-paying holdings.
Privacy-first sharing
Generate read-only share links or download clean PNG cards that display relative allocations without exposing exact dollar amounts or share counts.
Instant fundamental research
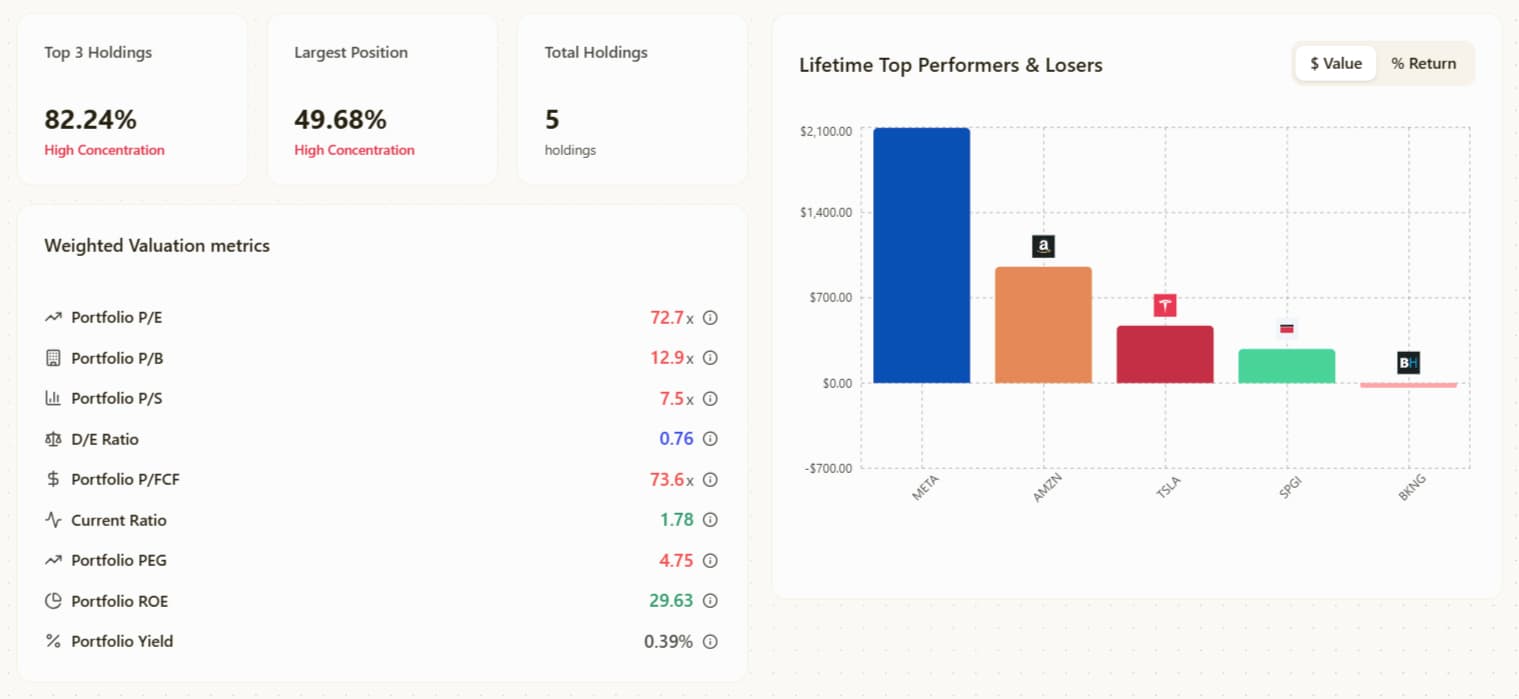
Click any holding in your portfolio to open 35+ years of financial statements, AI filing takeaways, and valuation models.

Workflow
How to use it in research
Start with a ticker, use the feature for the specific research job, then jump into the next Chartloom view when more context is needed.
Create your portfolio
Start free with 1 portfolio and up to 15 holdings. Enter each position manually with ticker, shares, and purchase price.
Review performance & cash flow
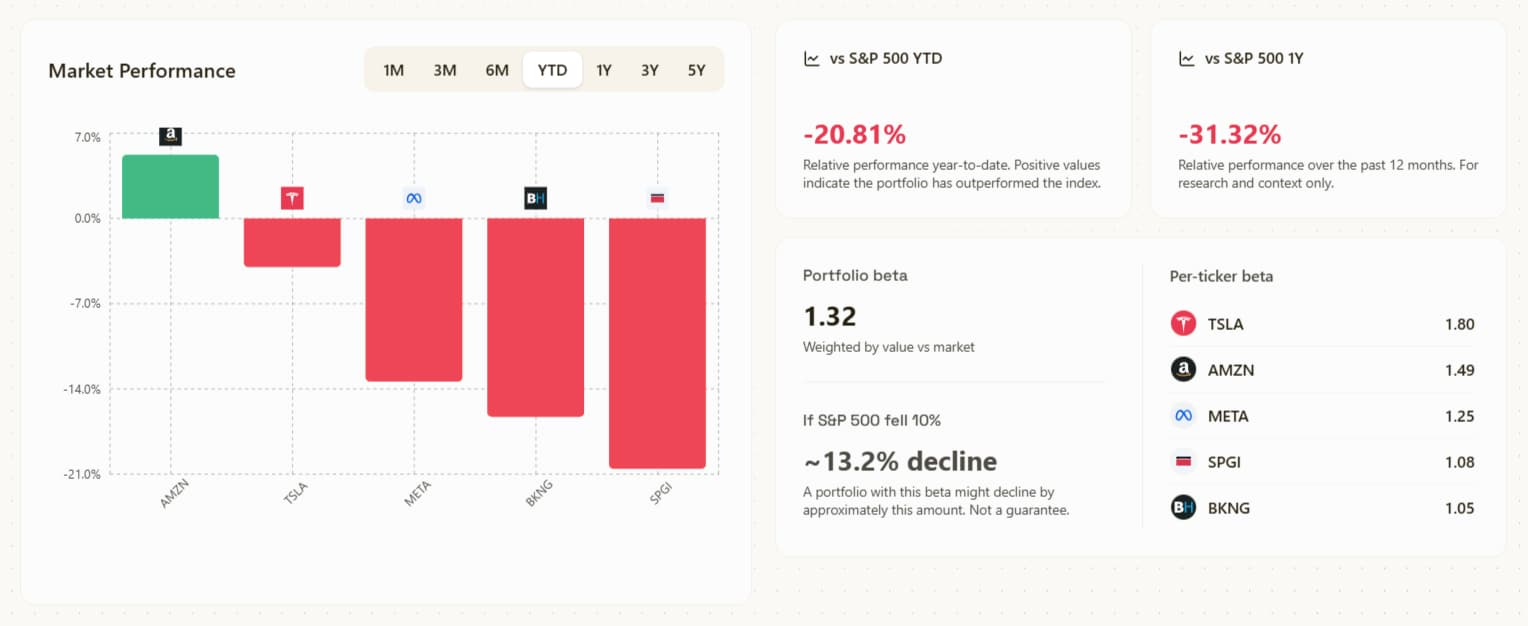
Track total gains, sector diversification, dividend schedules, and dollar-cost averaging history.
Deepen your research
Open any holding to review valuation metrics, quarterly earnings, and AI-summarized SEC filings.

Product view
A portfolio tracker for holdings and research
Start free with 1 portfolio and up to 15 stocks. Track holdings manually, review performance and allocation, follow dividends and DCA, and open any holding for deeper research. Pro expands the limits for larger portfolio tracking.
FAQ
Frequently asked questions
Useful details about Portfolio, data coverage, and how the feature fits into a research workflow.
Is Chartloom a free stock portfolio tracker?
Yes. The Free plan includes 1 portfolio with up to 15 stocks. Pro expands this to 10 portfolios with up to 25 stocks per portfolio, along with deeper fundamental analytics.
Do I need to link my brokerage account?
No. Chartloom is a 100% manual portfolio tracker, meaning your brokerage login credentials are never requested or stored. You manually enter your tickers, share counts, and purchase prices.
Can I manage multiple investment portfolios?
Yes. Pro accounts can create up to 10 separate portfolios (e.g. Retirement, Growth, Dividend Income) and view them individually or aggregated in an all-portfolios view.
Does Chartloom track dividend income?
Yes. Chartloom automatically tracks dividend yields, past distributions, and projected annual dividend cash flow across your stock holdings.
How does the Dollar-Cost Averaging (DCA) tracker work?
When you add multiple buys over time for the same ticker, Chartloom automatically calculates your weighted average cost basis and tracks your DCA performance against current market prices.
Can I share my portfolio publicly without revealing my money?
Yes. Chartloom features a privacy-first sharing option and PNG export that displays your portfolio holdings and percentage weightings while completely hiding your actual share quantities and account values.