Custom Stock Watchlists · 50+ Fundamental Metrics
Track Your Stock Watchlist Across 50+ Fundamental Metrics
Basic ticker lists only show daily price moves and leave fundamental data buried in separate tabs. Build custom stock watchlists with 50+ columns for P/E, Forward P/S, EV/EBITDA, revenue growth, operating margins, Free Cash Flow Yield, and valuation alerts.
Free plan includes 1 watchlist (up to 8 stocks) · No card required
- Theme-based lists
- 50+ fundamental columns & data points
- Visual performance snapshots


5,000+
US Stocks
100+
Charts & Research Tools
35+ Years
Financial History
Research value
From price-only ticker lists to a 50-metric fundamental watchlist
Built for investors who want the important context first: what changed, where the numbers are moving, and which follow-up questions deserve deeper research.
Theme-based lists
Group stocks by sector, investment theme, growth stage, or watchlist research priority.
50+ fundamental columns & data points
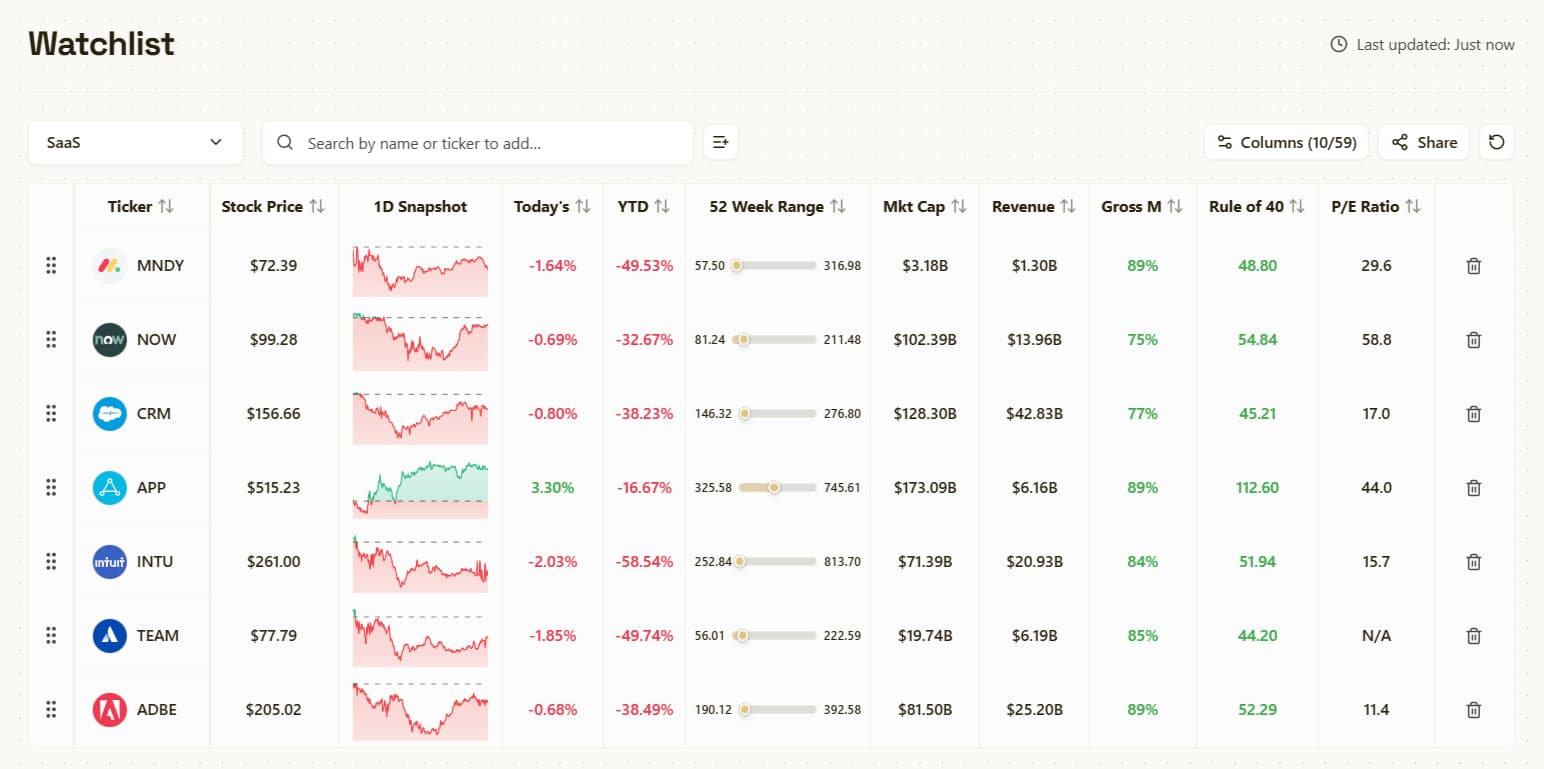
Customize your table with 50+ metrics including Price, YTD Return, Revenue Growth, Operating Margins, P/E, EV/EBITDA, Free Cash Flow Yield, and Rule of 40.
Visual performance snapshots
Spot daily movers, 52-week ranges, and mini trend charts at a glance without clicking through each stock.
Valuation & price alerts
Set automated alerts on Pro for custom valuation levels (such as FCF Yield or P/E) so you know when a followed stock reaches a chosen multiple or price.
Try Watchlist with a 14-day free Pro trial
Free plan available · No credit card required · Instant access to 5,000+ US stocks
Benefits
What Watchlist helps with
Practical research jobs: move faster, keep context together, and decide what deserves deeper analysis.
Theme-based lists
Group stocks by sector, investment theme, growth stage, or watchlist research priority.
50+ fundamental columns & data points
Customize your table with 50+ metrics including Price, YTD Return, Revenue Growth, Operating Margins, P/E, EV/EBITDA, Free Cash Flow Yield, and Rule of 40.
Visual performance snapshots
Spot daily movers, 52-week ranges, and mini trend charts at a glance without clicking through each stock.
Valuation & price alerts
Set automated alerts on Pro for custom valuation levels (such as FCF Yield or P/E) so you know when a followed stock reaches a chosen multiple or price.
High-resolution PNG export
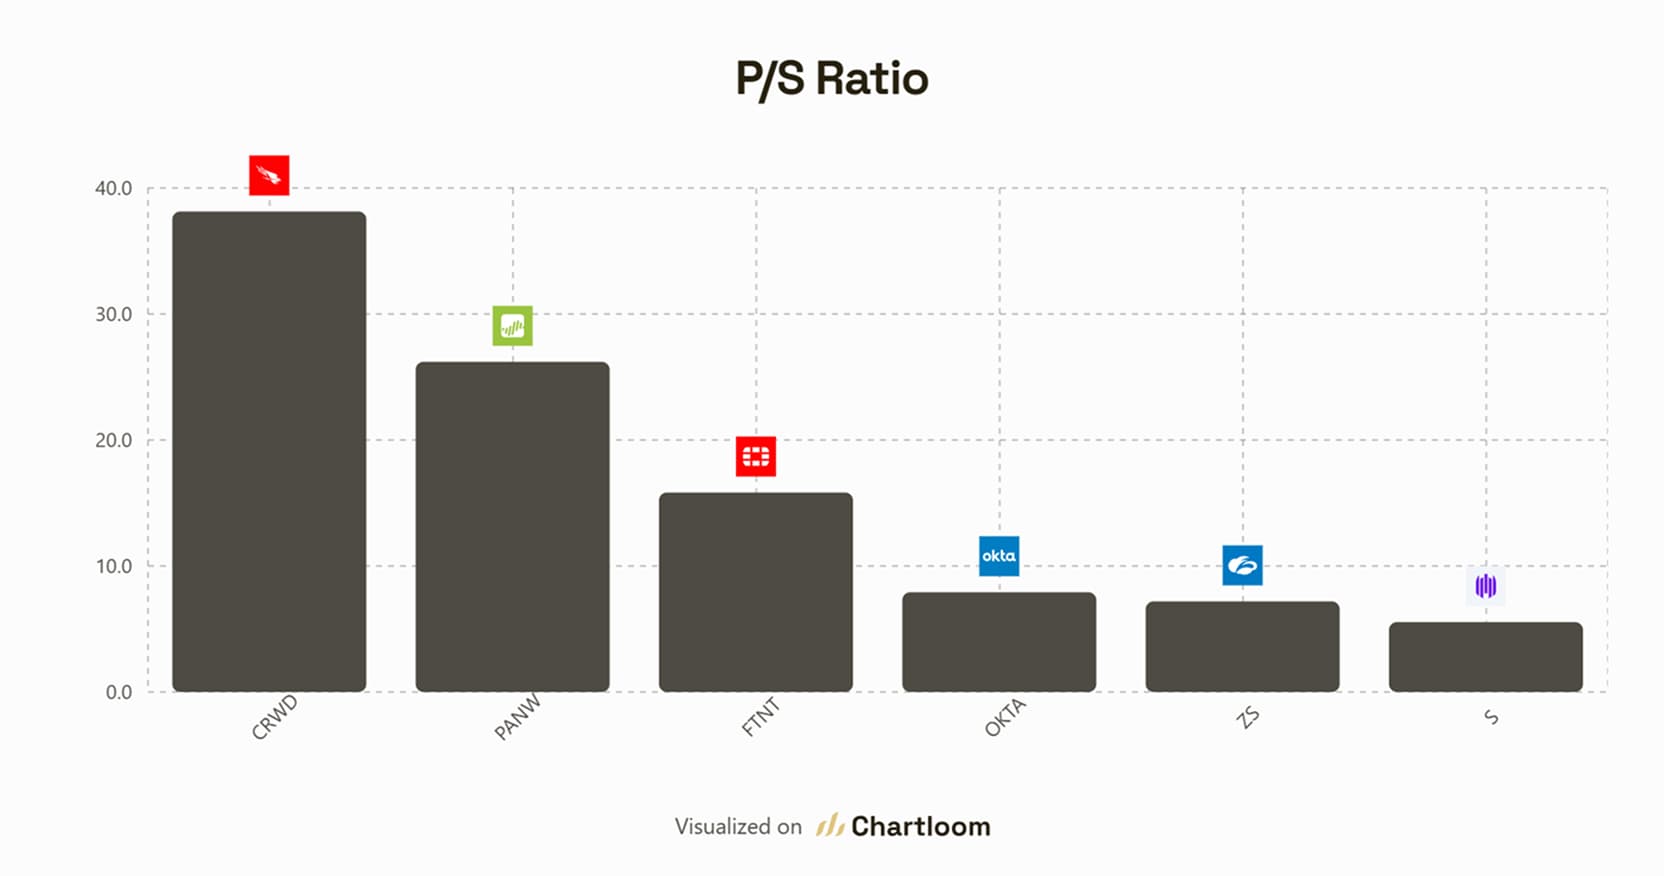
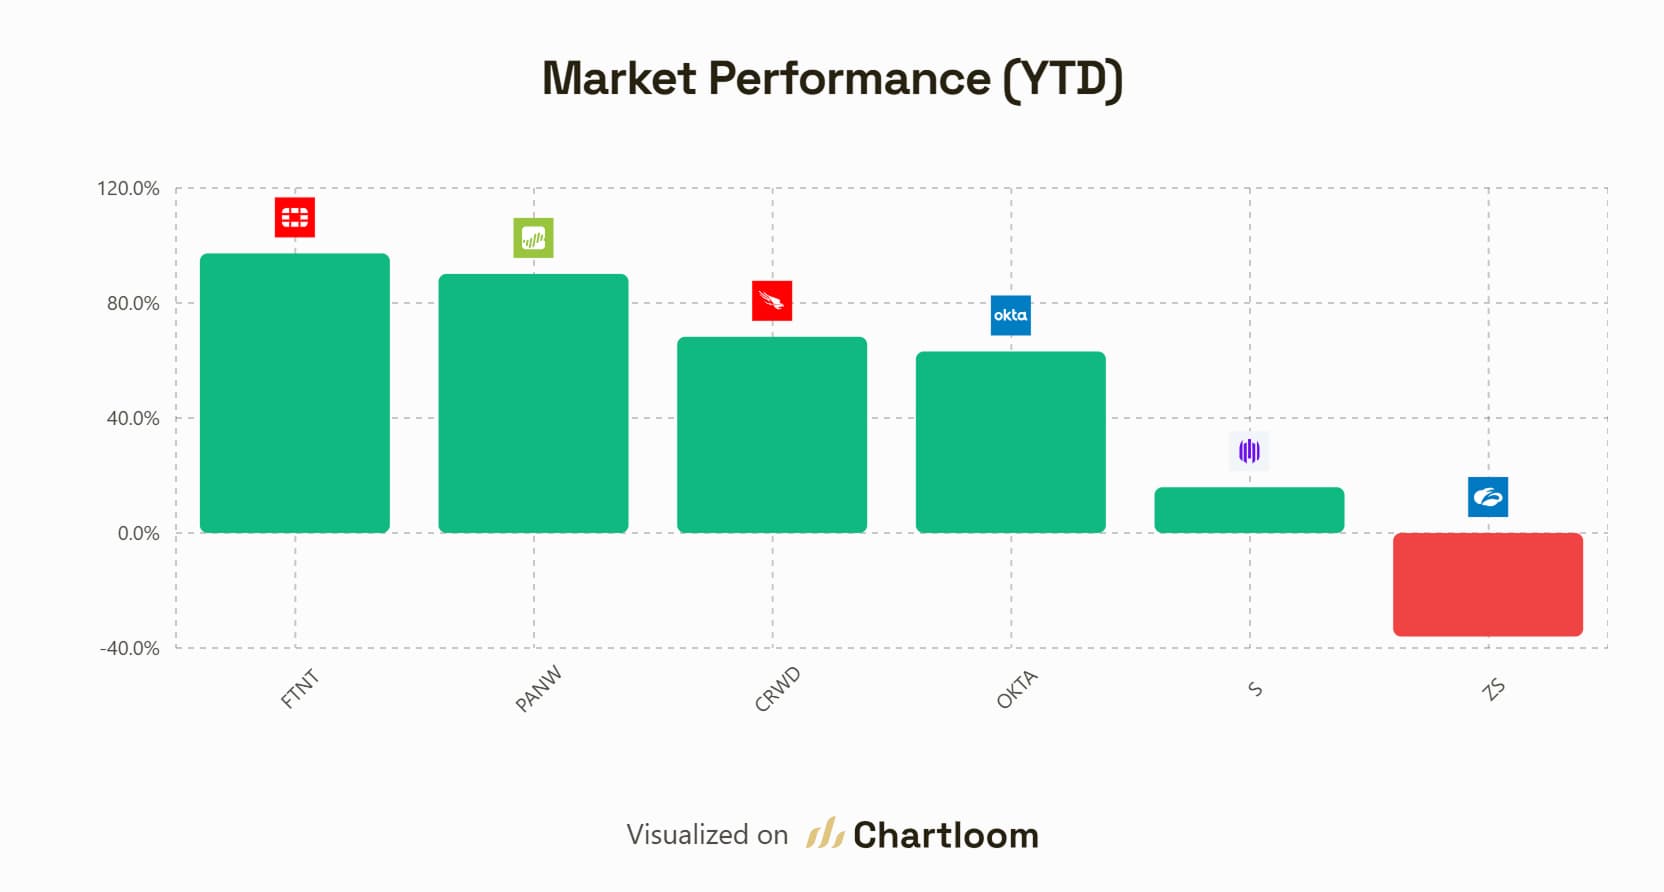
Export clean, branded watchlist cards with selected metrics to share in research notes, decks, or social posts.
One-click deep research
Jump straight from any watchlist row into full 35-year financial statements, AI filing breakdowns, or Scenario Lab.

Workflow
How to use it in research
Start with a ticker, use the feature for the specific research job, then jump into the next Chartloom view when more context is needed.
Create custom lists
Add tickers and group them by theme, industry, or research stage.
Customize your columns
Choose and compare from 50+ financial metrics and data points, reorder columns, and sort by growth, margins, or valuation.
Monitor and analyze
Scan daily movements, export PNG snapshot cards, set alerts, or click through to full company analysis.

Product view
A stock watchlist built for fundamental comparisons
Build lists around your investment thesis. Track price action alongside revenue growth, operating margins, valuation multiples, and Free Cash Flow Yield. Export clean PNG cards or open any ticker for deep fundamental research.
FAQ
Frequently asked questions
Useful details about Watchlist, data coverage, and how the feature fits into a research workflow.
What makes Chartloom watchlists different from basic ticker lists?
Traditional watchlists only show price and percentage change. Chartloom watchlists combine real-time pricing with 50+ fundamental metrics and customizable columns including revenue growth, profit margins, Free Cash Flow Yield, and valuation multiples.
Can I create multiple stock watchlists?
Yes. The Free plan includes 1 watchlist with up to 8 stocks. Pro ($10/month, with a 14-day free trial) adds multiple themed watchlists and custom column views for each list.
What financial metrics can I display in my watchlist?
Choose from 50+ columns across valuation, margins, growth, and cash flow, including market cap, 1D snapshot, YTD return, 52-week high/low, revenue, revenue growth, gross and operating margins, P/E, Forward P/E, Forward P/S, Free Cash Flow Yield, Rule of 40, sector, and industry.
Can I share or export my stock watchlist?
Yes. You can export any watchlist as a clean, high-resolution PNG image containing your selected columns, ideal for research documentation and sharing.
Does the watchlist support valuation alerts?
Yes. You can set custom alerts based on stock price or key valuation thresholds like Free Cash Flow Yield and P/E multiples.
How is a watchlist different from the Portfolio tracker?
A watchlist is for researching and monitoring prospective ideas before taking a position. A portfolio tracks real holdings with buy prices, quantities, cash allocation, dividend income, and DCA performance.