Visual fundamental research for 5,000+ US stocks
Explore 100+ financial and valuation charts across decades of data.
Compare companies side by side and model bull, base, and bear cases in Scenario Lab.
Start free · No signup or card required


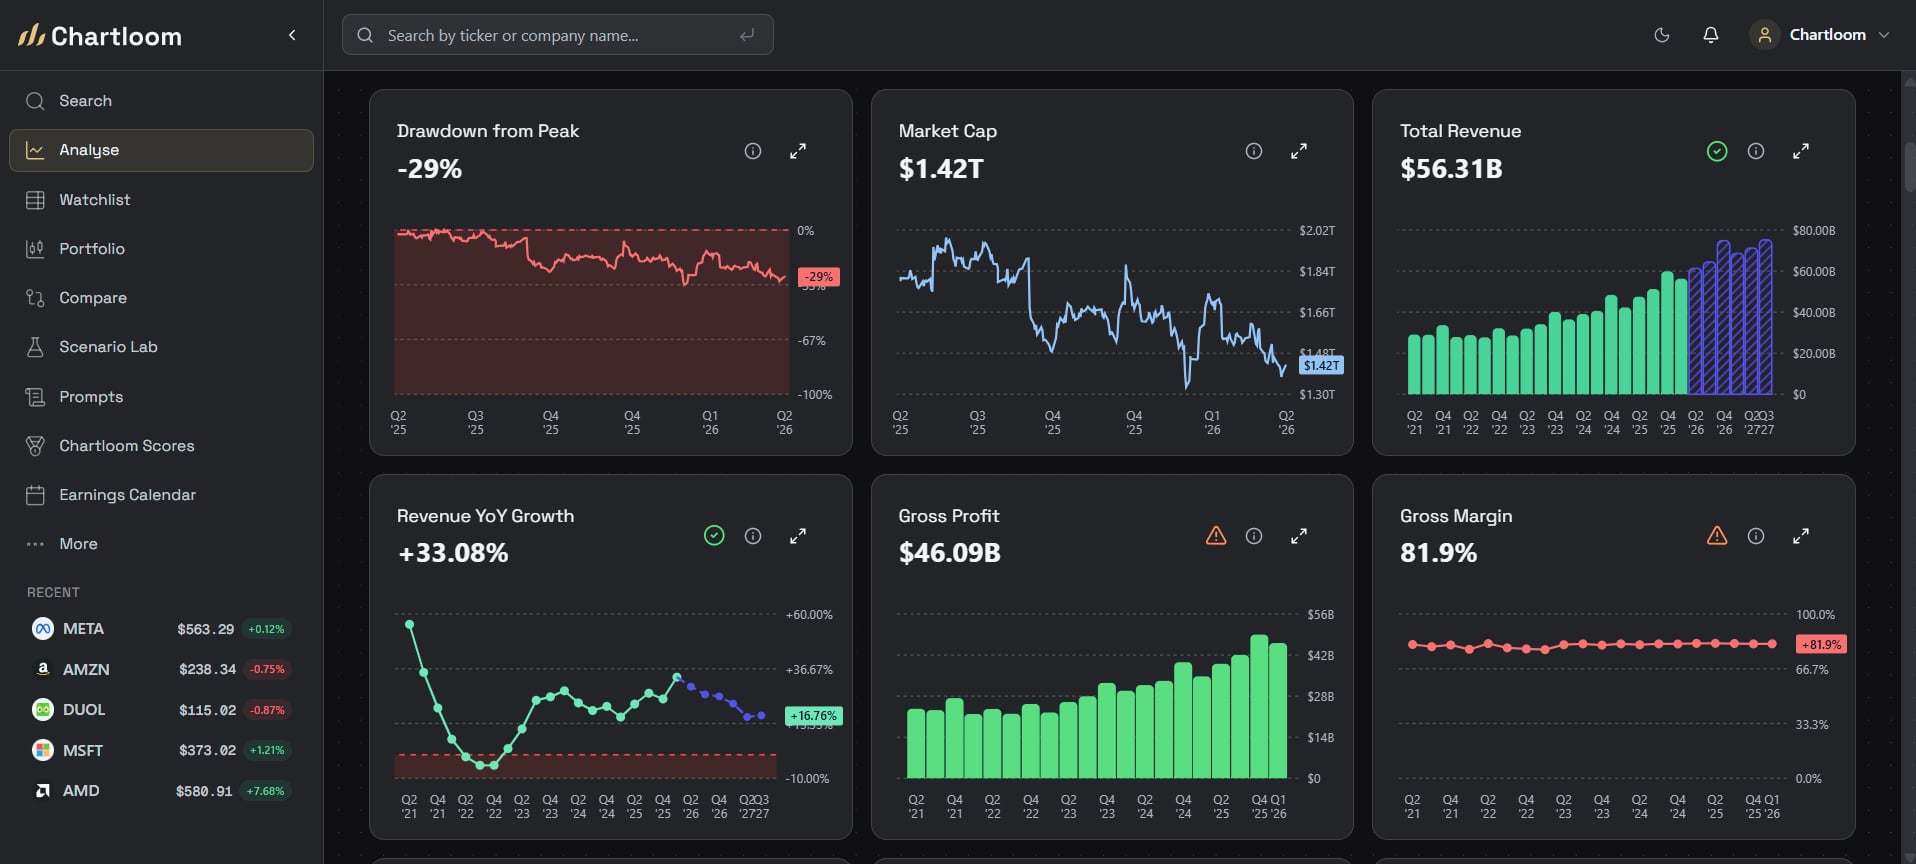
Chartloom platform coverage
5,000+
US Stocks
100+
Charts & Research Tools
35+ Years
Annual history · 15Y quarterly
Visual fundamental stock research in charts
Chartloom is for visual fundamental research on US stocks — 100+ interactive financial charts, historical valuations, AI SEC filing summaries, and Scenario Lab bull/base/bear modelling.
- 100+ interactive financial charts with up to 15 years of quarterly data and 35+ years of annual data
- AI SEC filing summaries of official 10-K and 10-Q disclosures
- Scenario Lab for bull, base, and bear modelling
- Compare Chartloom with other stock research tools on features and coverage
How it works
Research a stock in 3 steps
From ticker search to conviction — one workflow, not a stack of tabs.
Search a ticker
Start with any US stock.
Understand the business
Explore AI summaries, filings, charts, and fundamentals for business context.
Build conviction
Analyse valuation, compare companies, and test scenarios.
Search for a US stock to start researching
Simple, transparent pricing
Start free for light research, or upgrade to Pro to unlock all Chartloom features. Cancel anytime.
Free forever. No card needed.
- 10 years of financial data
- 8 charts per company
- AI Business Overviews
- 1 watchlist and 1 portfolio
- Browse any US stock
14-day trial. No card required.
- 35+ years of financial data
- 100+ interactive charts
- Compare up to 3 stocks side by side
- AI analysis: business, moat & risks
- US stock screener: filter 5,000+ stocks
- Bull, bear & base case modeling
- Advanced watchlists & chart overlays
- Valuations, Alerts & Insider Data
- Portfolio, Dividends & Insights
Research stocks with institutional-grade charts. Start free, then try Pro for 14 days. No card needed.
Frequently Asked Questions
What is Chartloom?
Chartloom is a visual fundamental research platform for self-directed US stock investors. It combines up to 15 years of quarterly financials and 35+ years of annual financials, 100+ interactive charts, AI summaries of SEC filings, Scenario Lab bull/base/bear modelling, DCF valuations, watchlists, and a customisable dashboard in one workspace. It focuses on long-term US equity analysis rather than day trading or real-time tick data.
Who is Chartloom for?
Chartloom is built for investors who research individual US stocks — from those outgrowing free tools to experienced hobbyists managing meaningful portfolios. It suits value-oriented and growth investors who want filing-level context, scenario modelling, and long-term fundamentals. It is not designed for day traders, options traders, passive index-only investors, or anyone who needs broad international market coverage.
Is Chartloom a good alternative to Koyfin, TIKR, YCharts, or Seeking Alpha?
Yes — for self-directed US equity research, Chartloom can replace much of a fragmented, multi-tool workflow at a lower price. It includes filing-grounded AI SEC summaries, interactive Scenario Lab modelling, and a fully customisable dashboard in one Pro plan, typically two to five times cheaper than comparable paid platforms. Seeking Alpha leans on articles and ratings, while Koyfin and TIKR offer broader scope at higher price points. Chartloom concentrates on depth-first US equity analysis.
Is Chartloom free, and how much does Pro cost?
Yes. The free stock research tool covers 5,000+ US stocks with 8 charts per company, about 10 years of annual data, and AI business overviews, with no credit card. New accounts also get a 14-day Pro trial, which includes Compare. After the trial, the account stays on the Free Plan, and Pro is $10/month.
Where does Chartloom’s financial data come from?
Chartloom uses institutional-grade third-party market data combined with official SEC filings, with SEC EDGAR used to ground every AI summary in the actual filing text. Coverage includes income statements, balance sheets, cash flow, analyst estimates, insider transactions, and valuation ratios — up to 35+ years of annual data and 15 years of quarterly data for US-listed equities.
Can I visualize historical quarterly financials and SEC filing data on Chartloom?
Yes. Chartloom provides up to 35+ years of annual statements and 15 years of quarterly financials for US-listed stocks. Investors can visualize income statements, balance sheets, cash flows, valuation ratios, and margins across 100+ interactive charts, alongside AI-generated summaries of official 10-K and 10-Q SEC filings.
Is my data secure with Chartloom?
Yes. Chartloom uses industry-standard encryption and security practices, and your portfolio data, watchlists, and personal notes are stored securely and never sold or shared with third parties. Payments are handled by Stripe, a PCI-compliant merchant of record, so full card details never touch our servers.
Does Chartloom provide financial advice?
No. Chartloom is a research and analysis tool only. It does not provide financial, investment, or tax advice, and it does not offer opinions on whether to acquire or dispose of any security. All content is informational, and investors are encouraged to conduct their own due diligence.
Featured guide
Learn the full research workflow
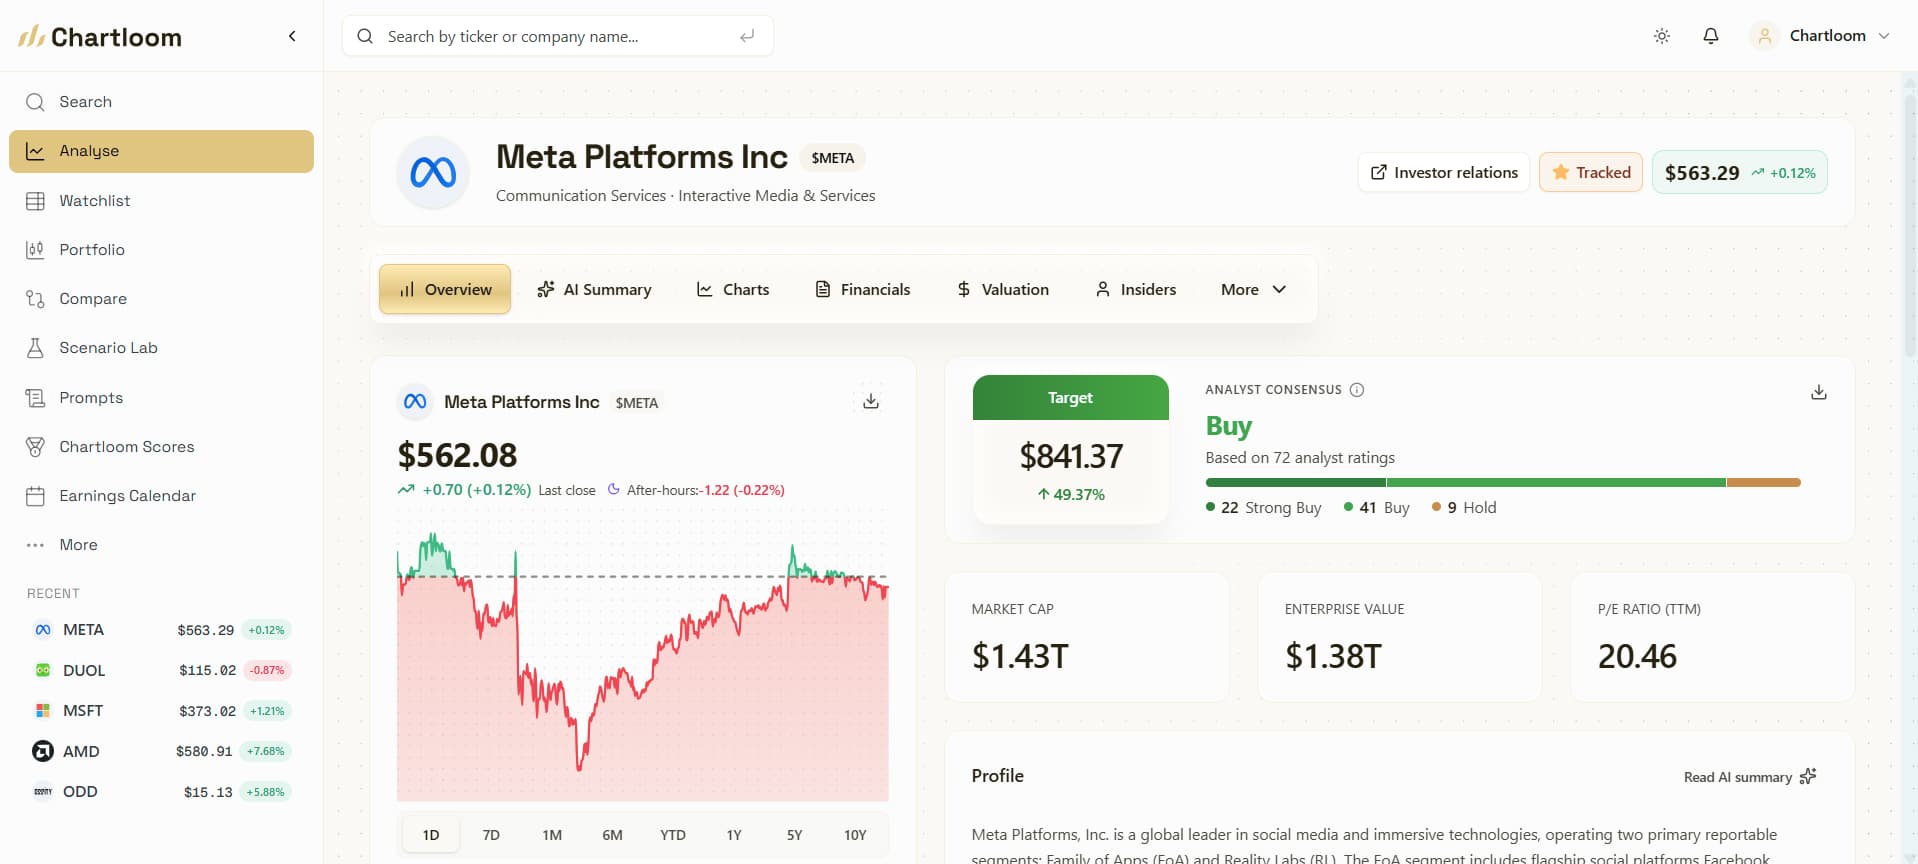
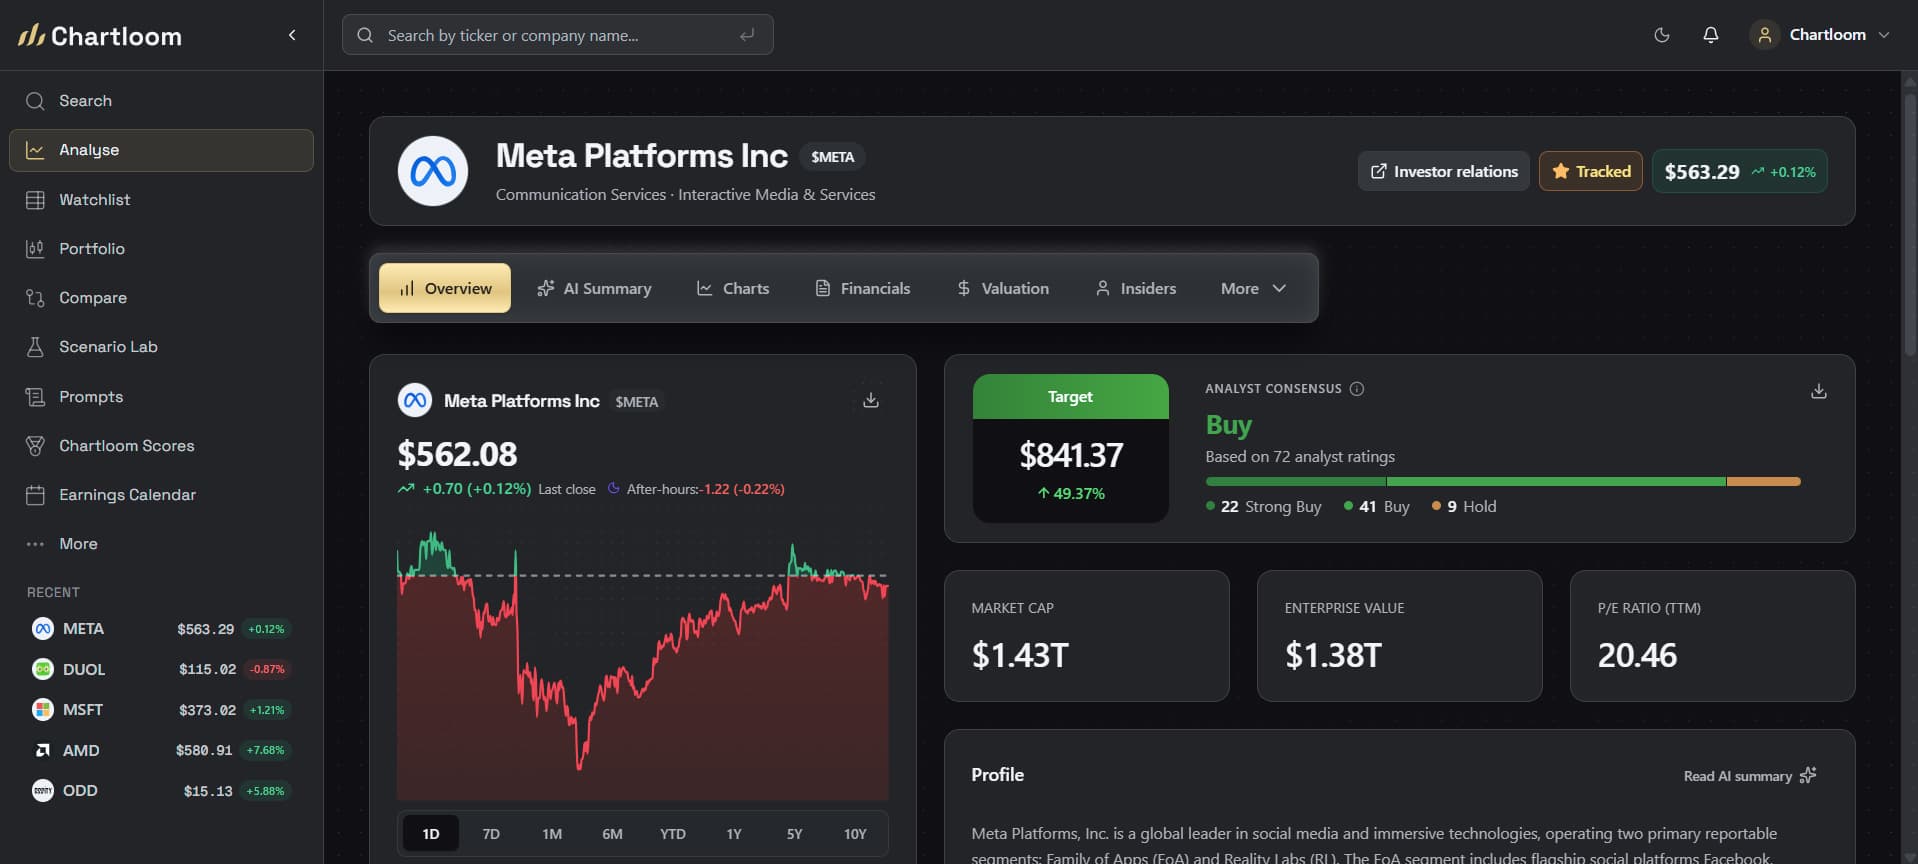
A step-by-step walkthrough of how investors can research a stock in Chartloom, from the business story to tested scenarios.
Stock Research Guide · 9 min read
How to Use Chartloom for Stock Research
A repeatable 6-step workflow: understand the business with AI summaries, confirm trends in the charts, judge valuation in context, weigh insider and analyst signals, compare peers, and model bull, base, and bear cases.