Stock Research GuidesChartloom Team<9 min read
How to Use Chartloom for Stock Research: A 6-Step Workflow
Last updated: 2026-07-08
Researching a company means moving from a broad understanding of the business down to the specific numbers, then stress-testing the assumptions behind them. This guide walks through a repeatable six-step workflow in Chartloom: reading an AI filing summary, reviewing financial charts, checking valuation against a company’s own history, weighing insider and analyst signals, comparing peers, and modelling bull, base, and bear cases. Each step is educational and links to the relevant tool so the process can be applied to any supported ticker.
A repeatable research workflow
A consistent process makes research easier to repeat and easier to compare across companies. The workflow below moves from the broad picture to the details: understand the business, confirm the trends in the financials, judge valuation in context, weigh ownership and analyst signals, benchmark against peers, and finally test the assumptions with scenarios. Every company has a single research hub in Chartloom, so these views sit together under one ticker instead of across many browser tabs.
- Story first: what the company does, how it earns, and what could go wrong.
- Then the numbers: financial trends, valuation range, ownership, and estimates.
- Then the test: peer comparison and bull, base, and bear scenarios.
Step 1: Understand the business with AI Summaries
Before looking at any chart, it helps to know what the company actually does and how it makes money. AI Summaries synthesise the 10-K, 10-Q, analyst consensus, institutional ownership, and insider activity into a structured overview per ticker: key takeaways, the business and revenue model, growth drivers, recent developments, and the risks and financial concerns management or the data flag. Written in plain English, the summary helps decide which sections of the full filing to read in depth.
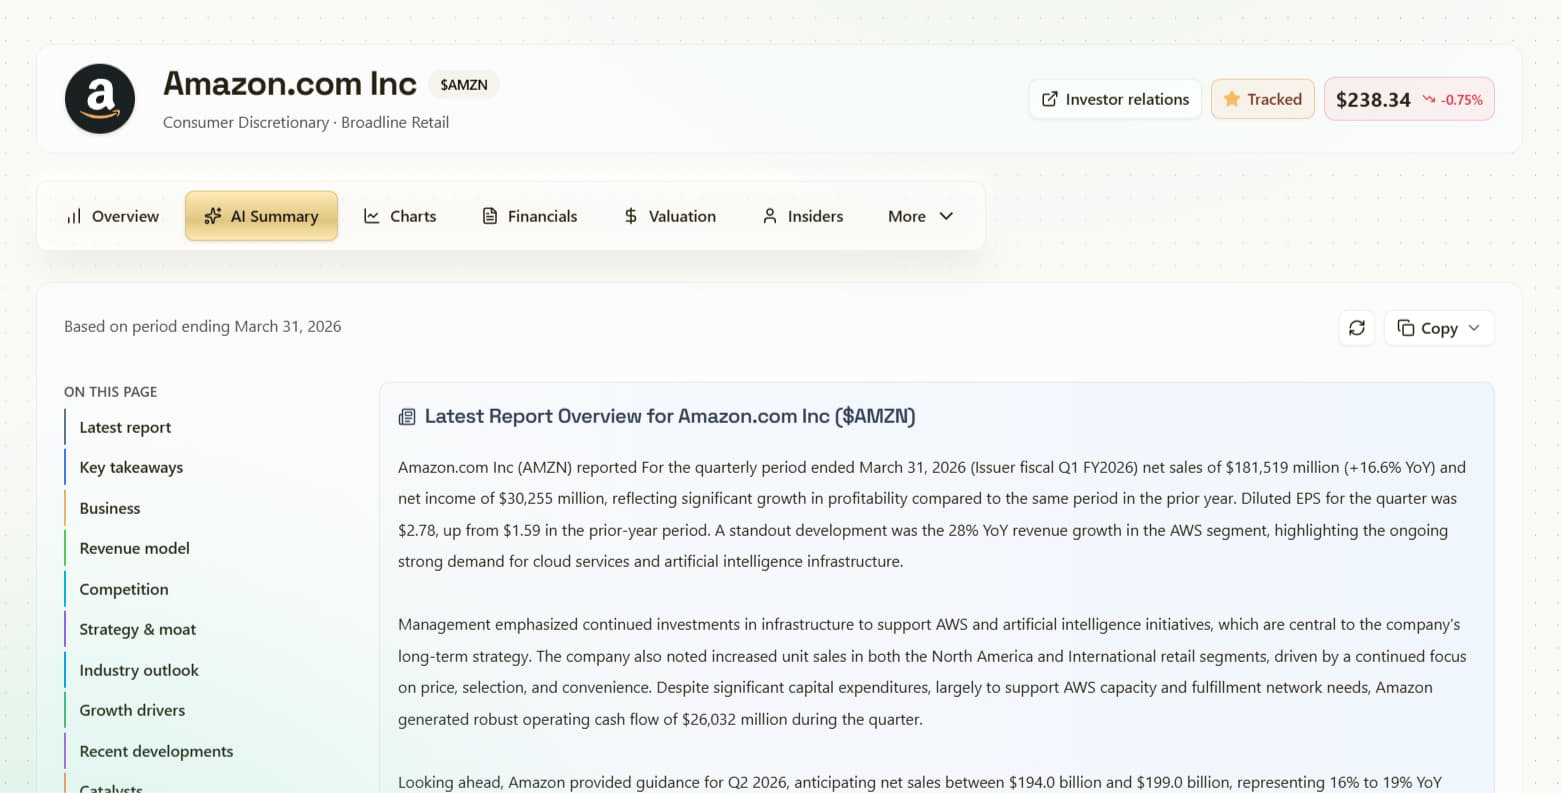
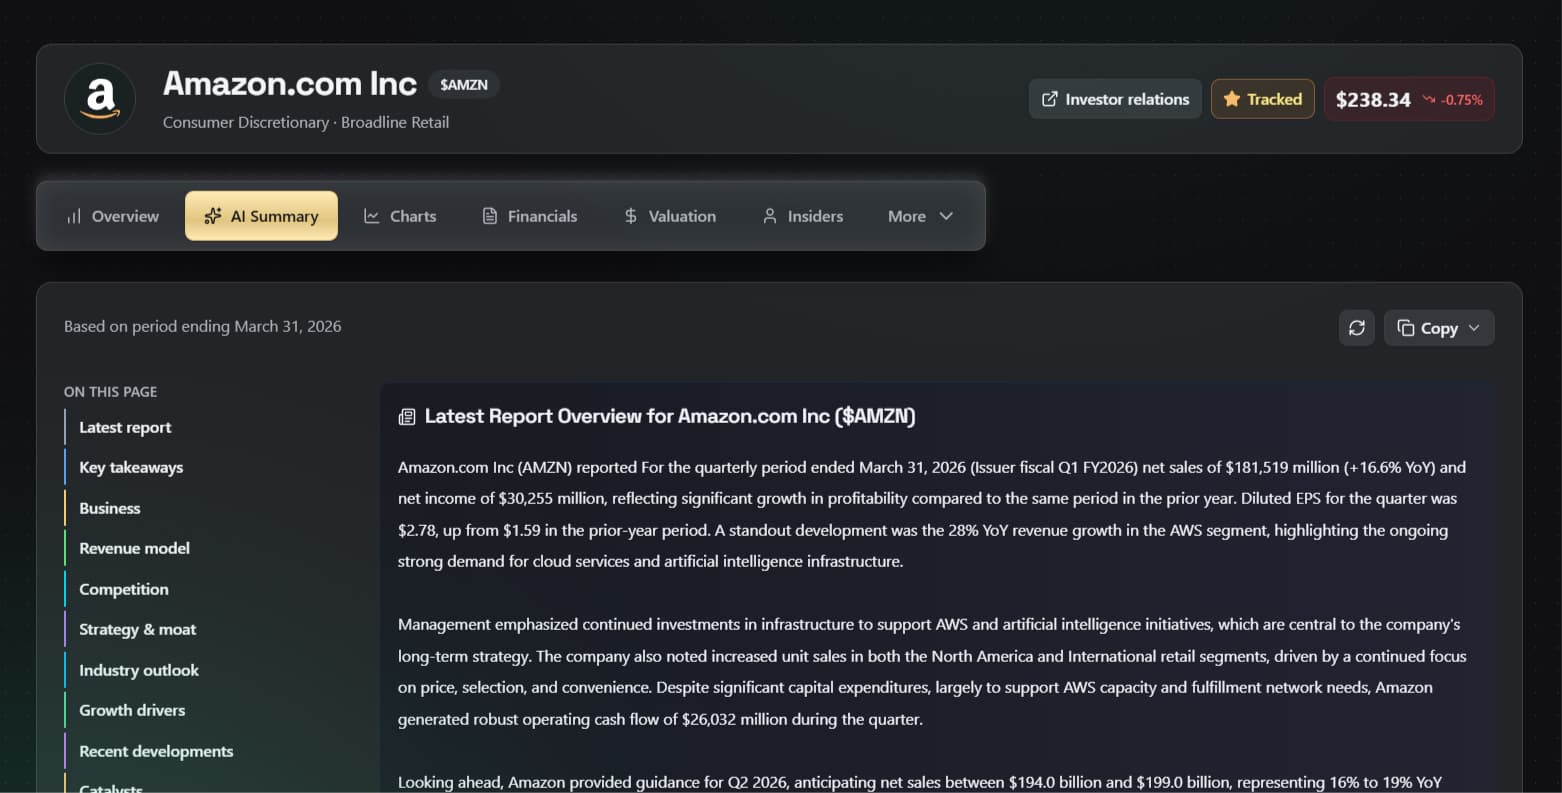
The risks and financial-concerns section is worth reading closely. It surfaces potential risks pulled from the filing, such as competition, customer concentration, or leverage, so they can be considered alongside the more positive parts of the story. The summary is research support only; it is not a substitute for the full filing.
Step 2: Review financials with visual charts
A single quarter rarely tells the full story. Charts make it easier to see whether revenue, margins, cash flow, and the balance sheet are improving or deteriorating over time. Chartloom includes 100+ charts per ticker across revenue, growth, profitability, cash flow, dividends, share count, and efficiency, with quarter, annual, and TTM views where available.
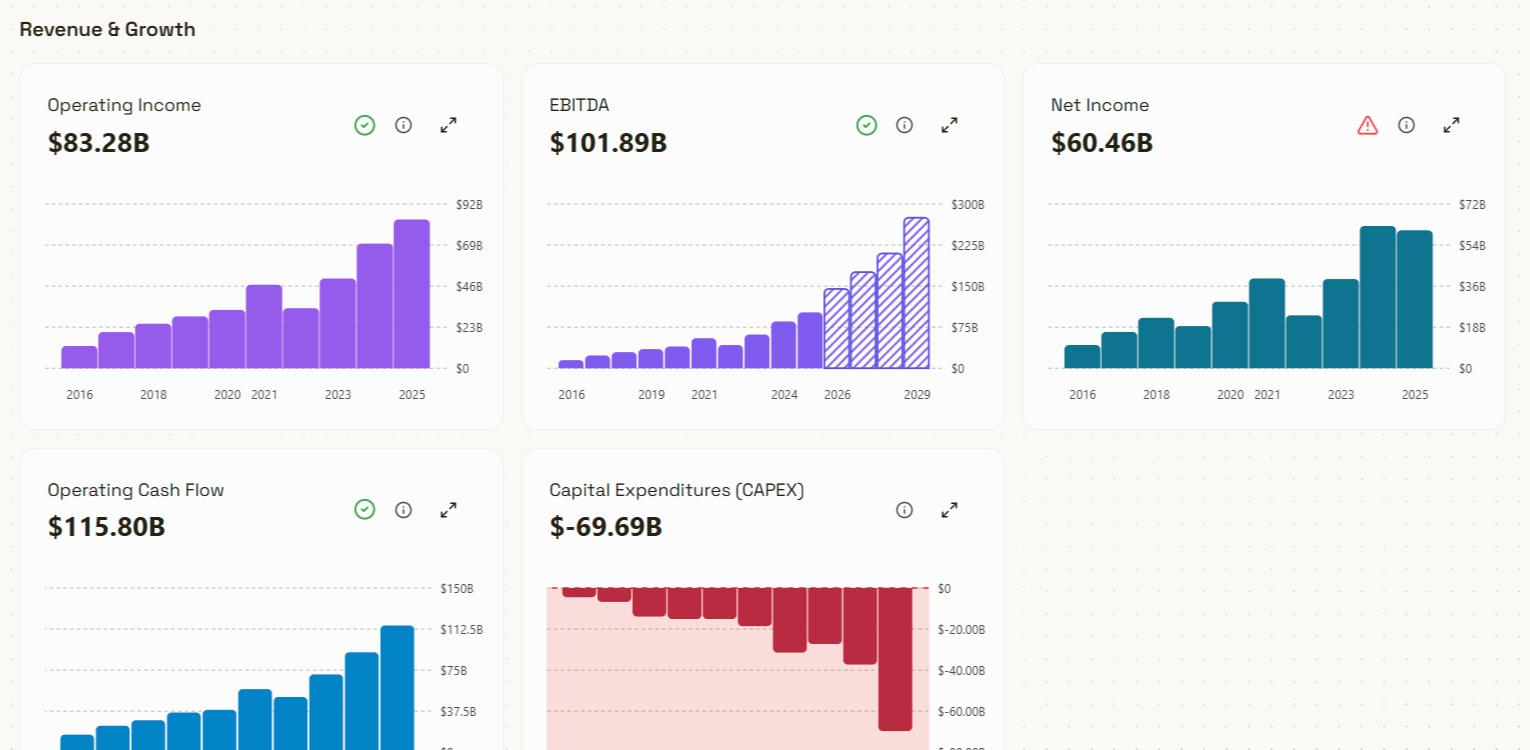
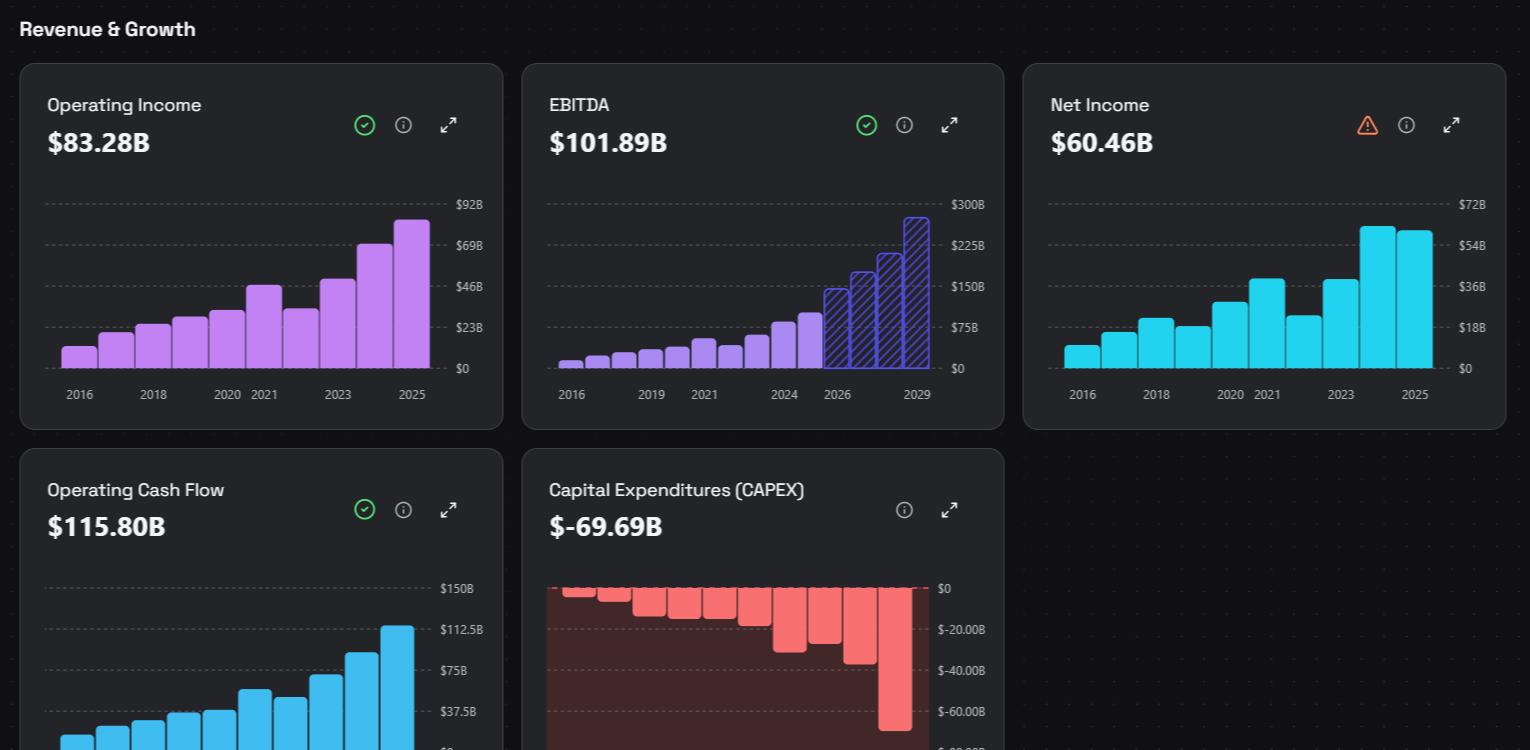
Each chart includes a short description, and many metrics have plain-English explanations, which is useful when a term is unfamiliar. The market data shows more when read as a trend: steady or improving margins can suggest pricing power or efficiency, while a declining trend may point to competition or cost pressure. Charts can also be exported as PNG for notes or reports.
Step 3: Check valuation against its own range
A valuation multiple in isolation says little. What often matters more is where a metric sits relative to the company’s own history. Chartloom’s valuation charts plot metrics such as P/E, forward P/E, P/S, and FCF Yield over time, making it easier to see whether a stock is trading toward the high or low end of its historical range.
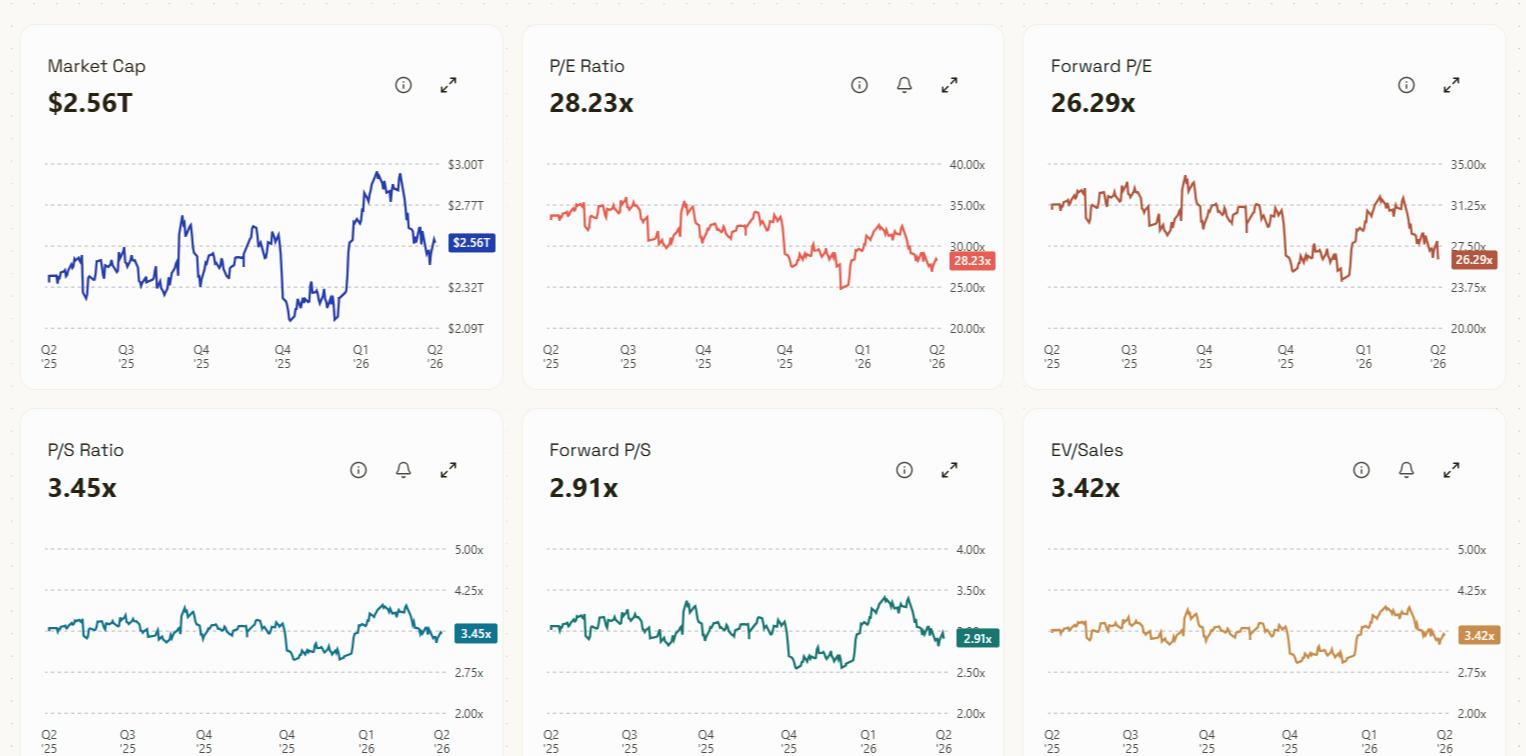
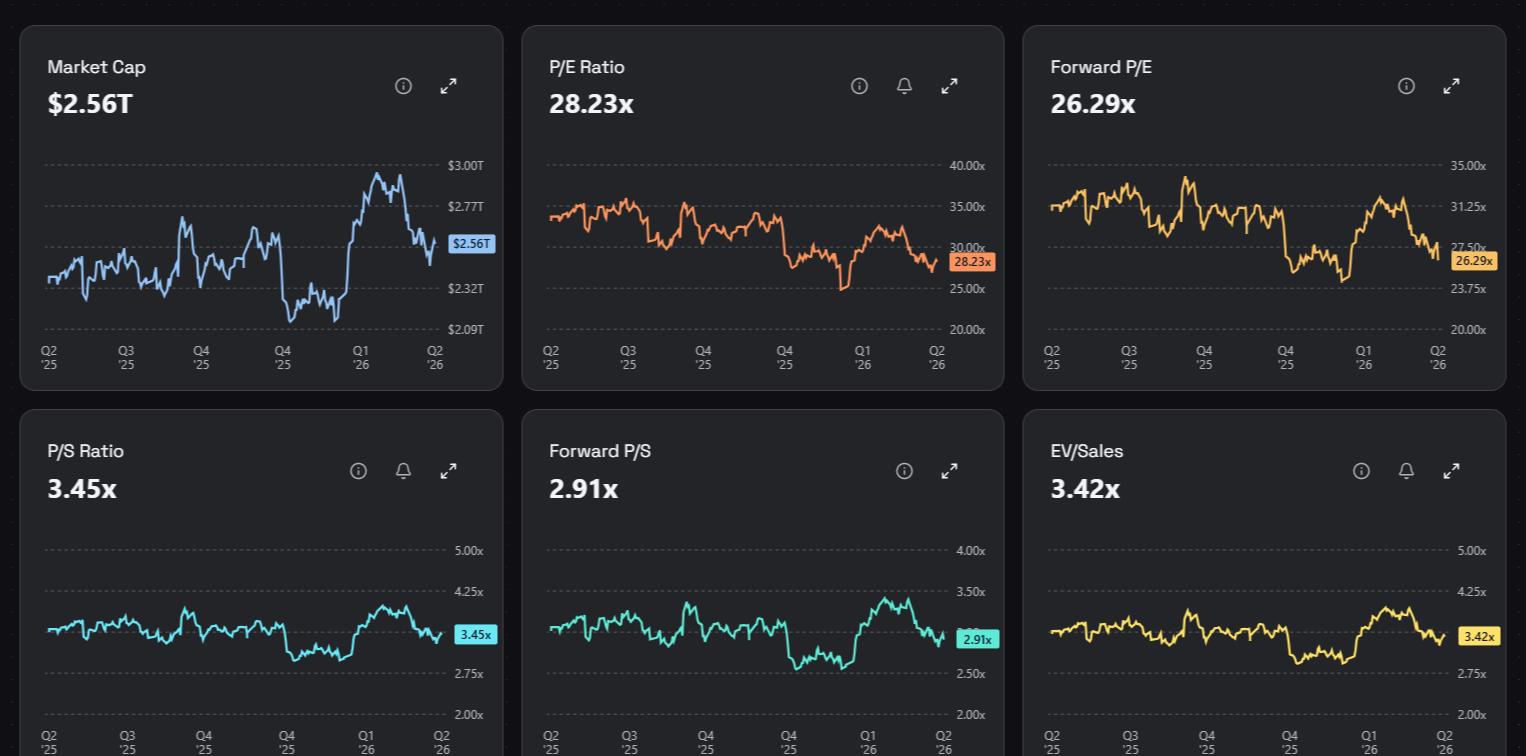
Reading valuation in context is more informative than a single number. A higher-than-average multiple might reflect stronger growth expectations; a lower one might reflect higher perceived risk. Saved valuation-level alerts can flag when a metric reaches a level worth revisiting, so the analysis can be picked up again later.
Step 4: Read insider and analyst signals
Ownership and estimate data add another layer of context. The ticker hub brings together insider transactions, institutional ownership, and analyst estimates alongside the rest of the research. These signals are informational: insider activity and analyst sentiment reflect how different participants view the company, and are best read together with the filings and the numbers rather than on their own.
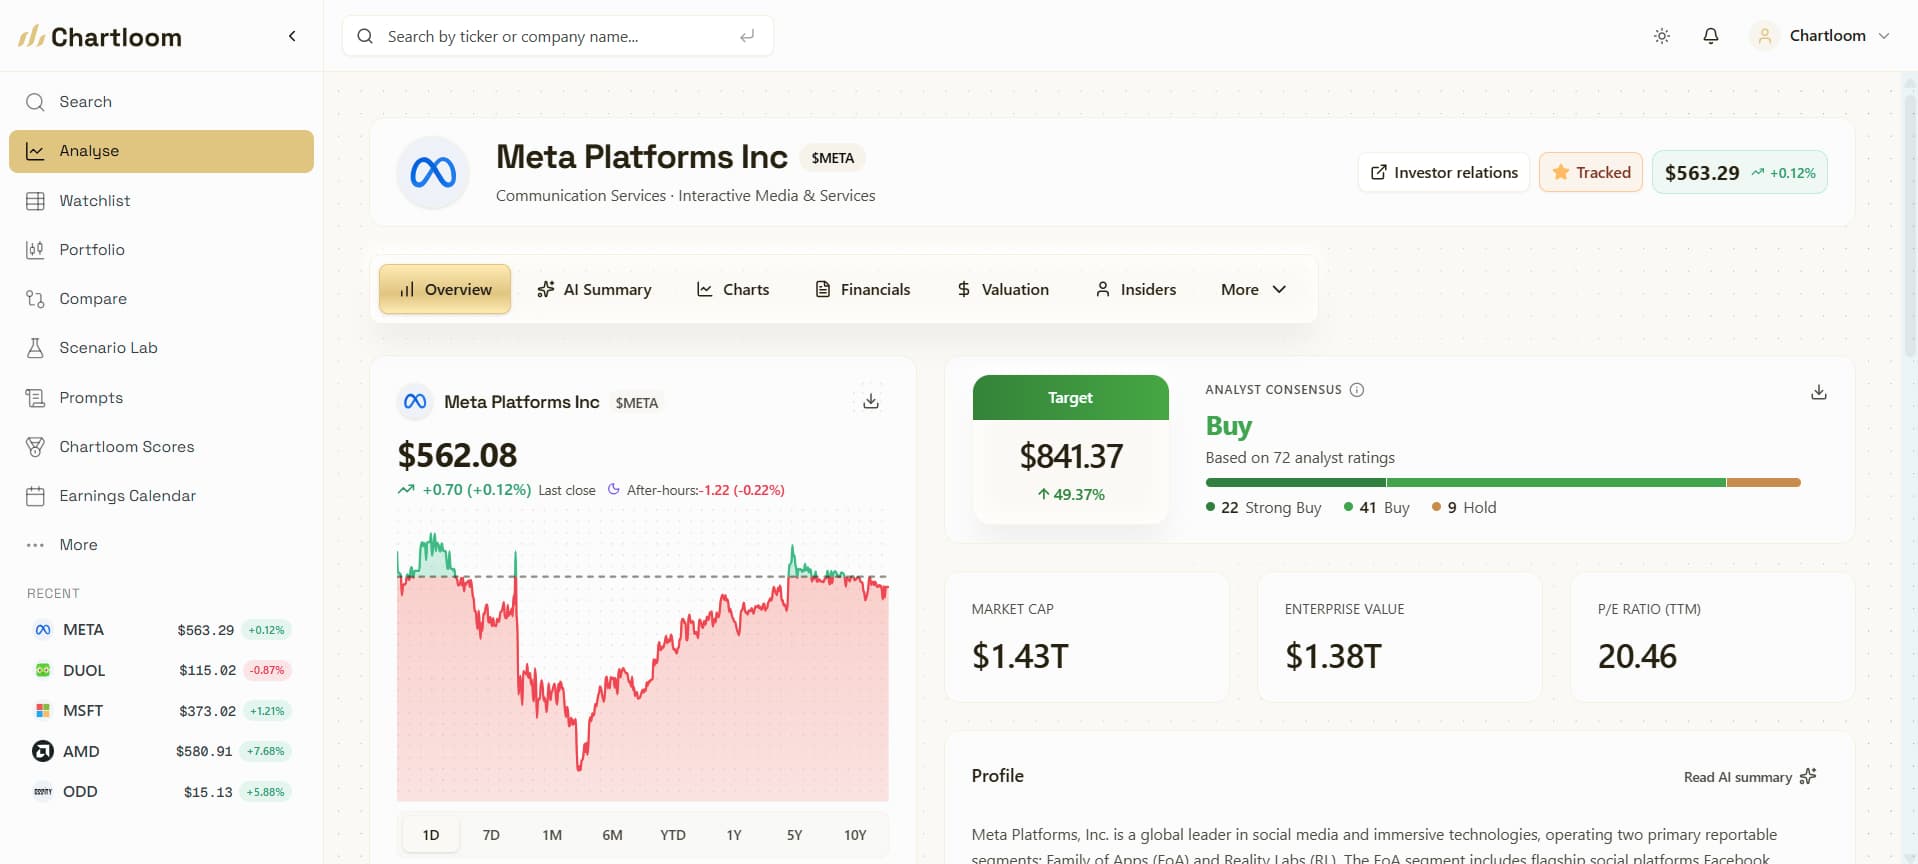
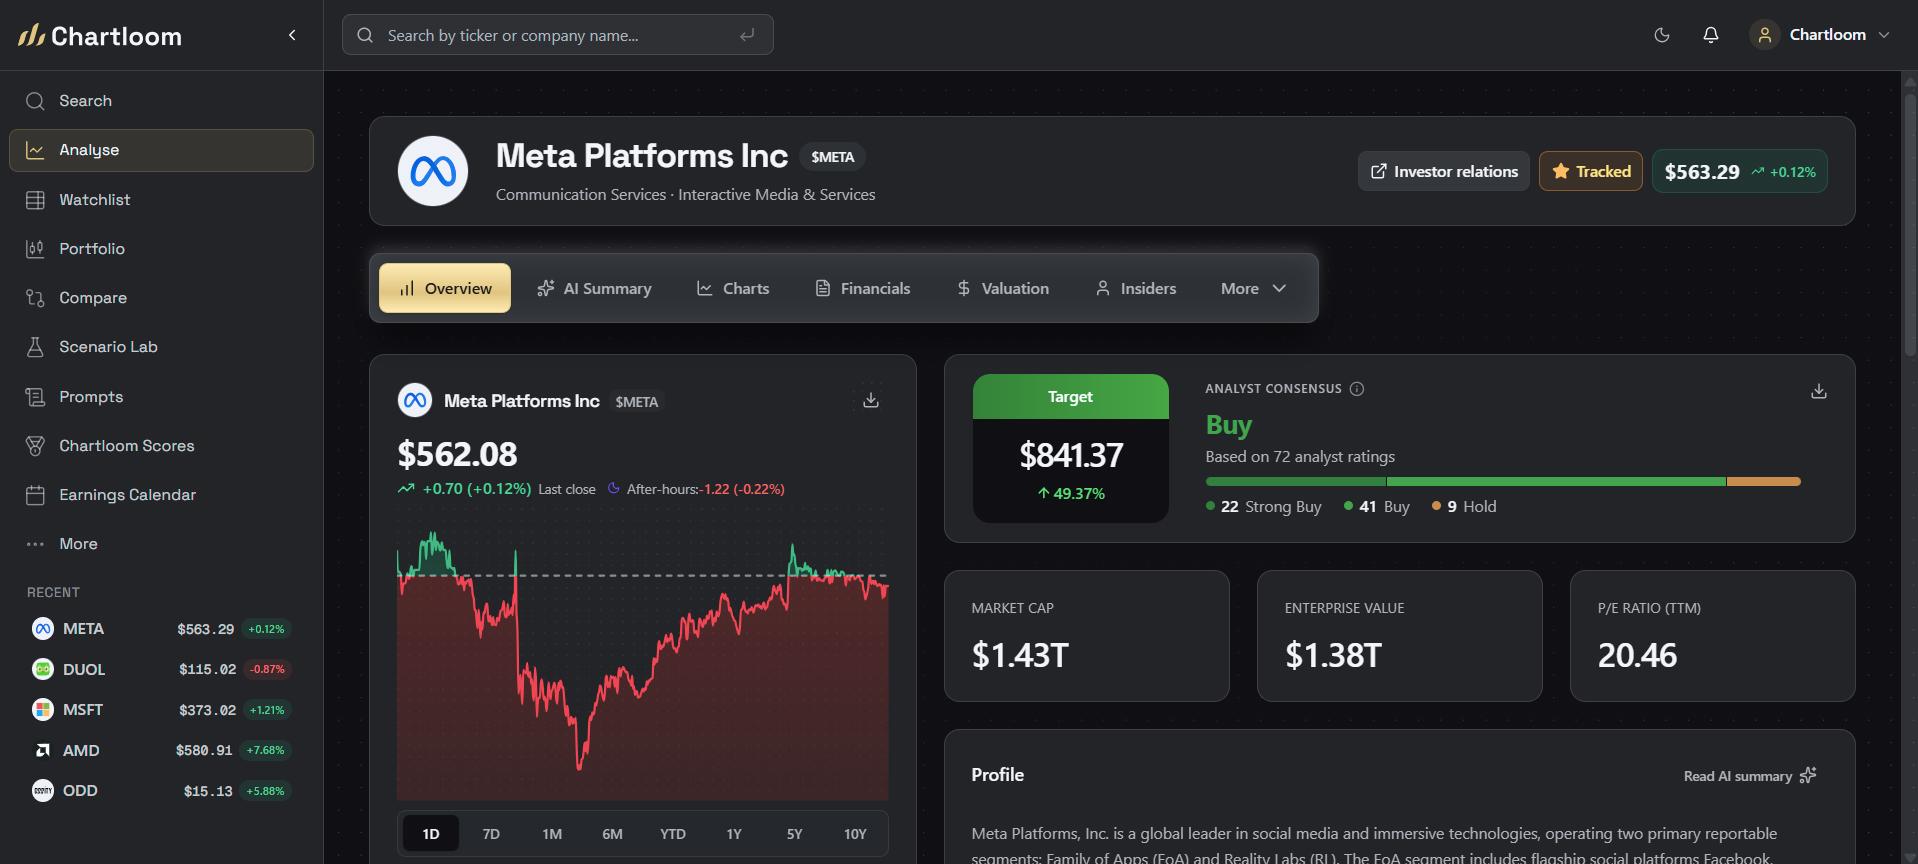
Two questions help here. Do the analyst estimates match the trends in the charts? And does insider and institutional activity line up with the company's story? Consensus estimates are expectations, not outcomes, so treat them as one input among several.
Step 5: Compare peers and competitors
A company rarely exists in isolation. Comparing valuation, growth, and margins against a small set of peers puts the numbers in context. Compare lines up to 3 stocks side by side across valuation, margins, revenue growth, market cap, FCF Yield, and performance, so the key differences are easier to scan without copying data into a spreadsheet. Compare is included on Pro and the 14-day trial. Visitors can preview one comparison before creating an account.
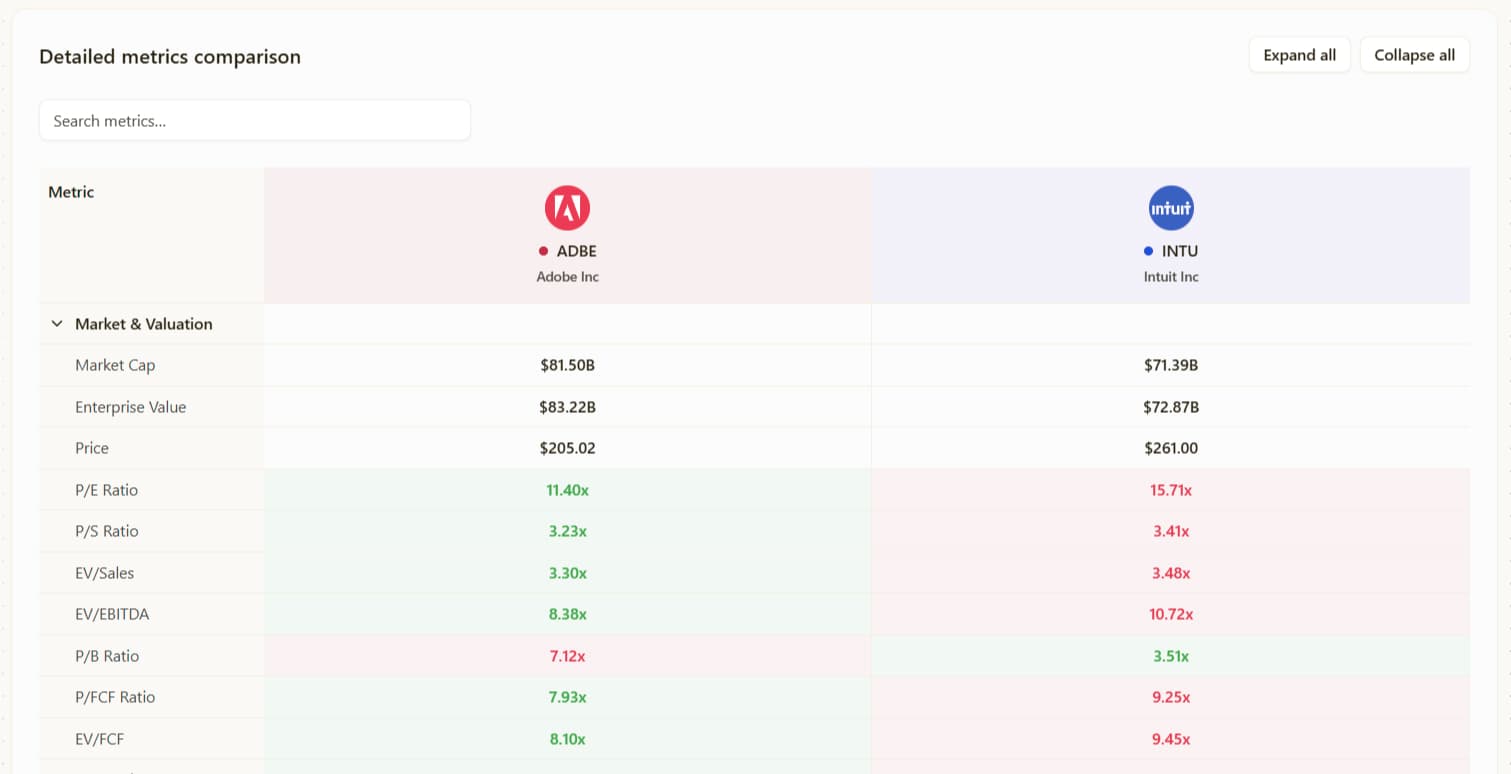
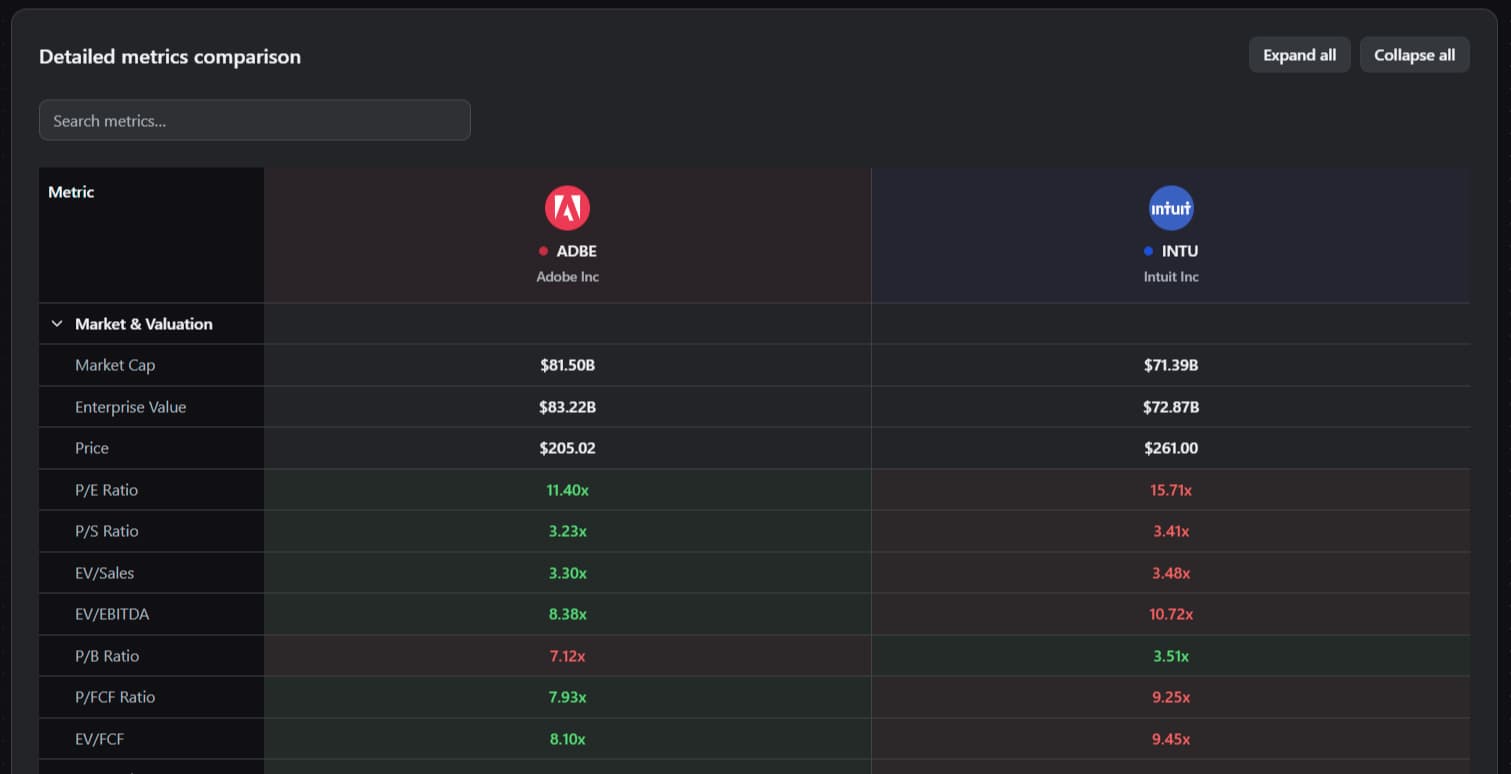
A high multiple can look more reasonable when growth and margins are meaningfully stronger than peers; a low one may reflect weaker fundamentals or higher risk. From any comparison, a ticker can be opened for deeper research in its full hub.
Step 6: Model bull, base, and bear cases
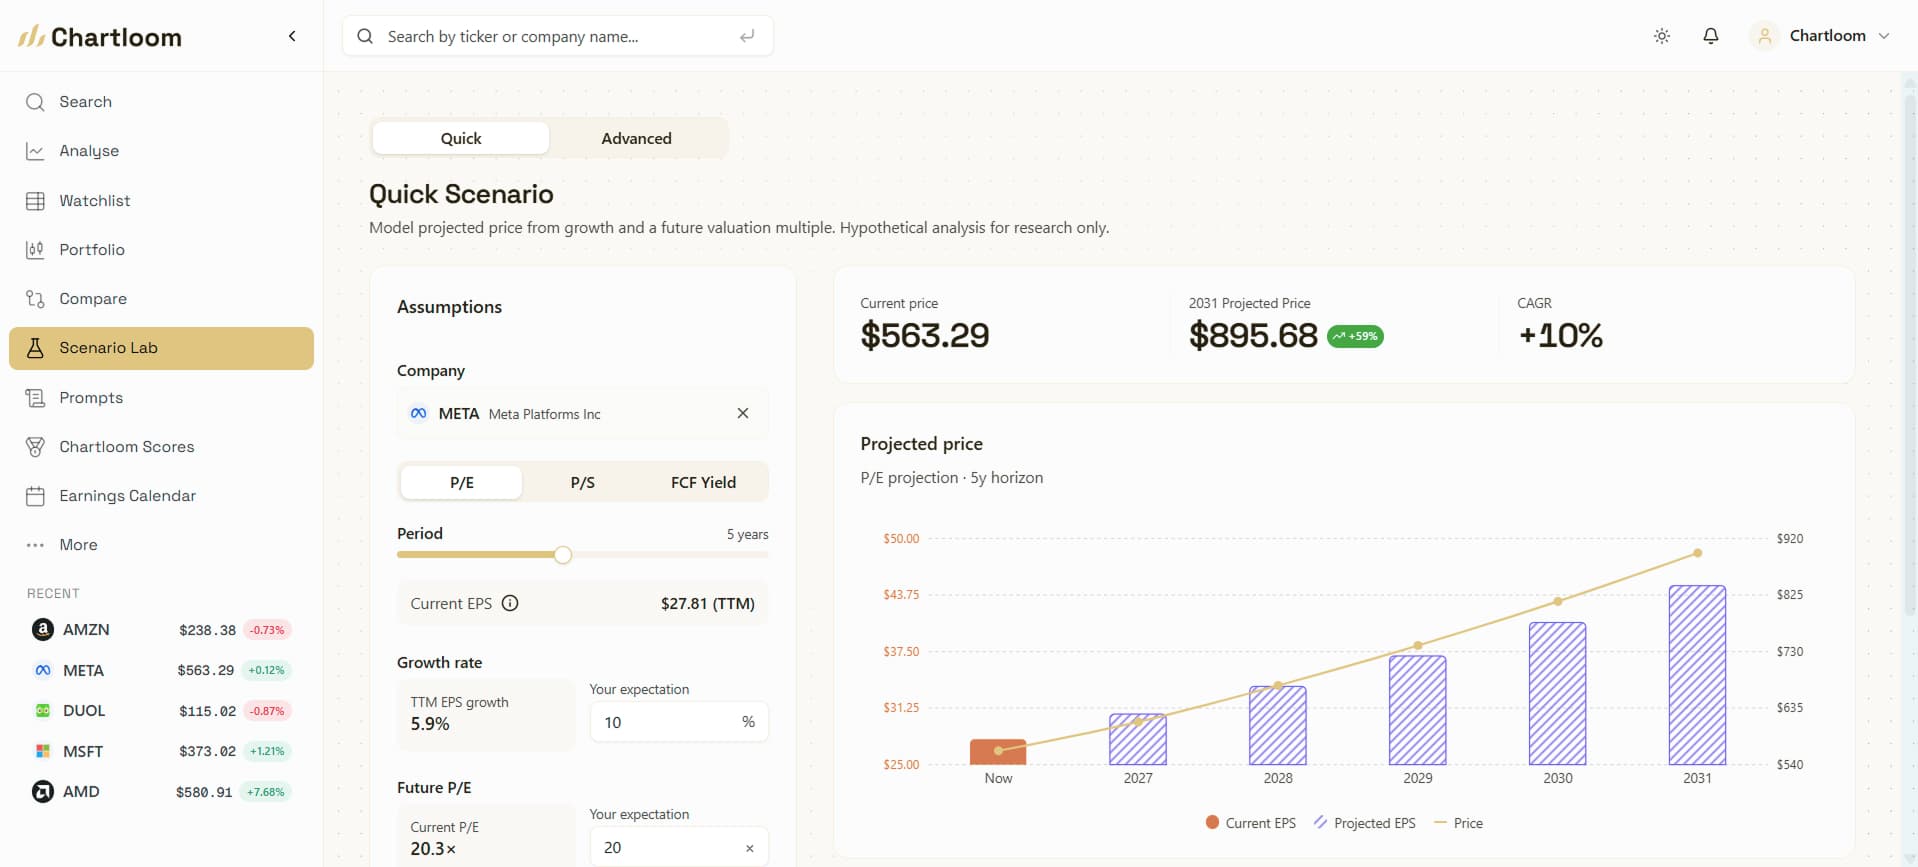
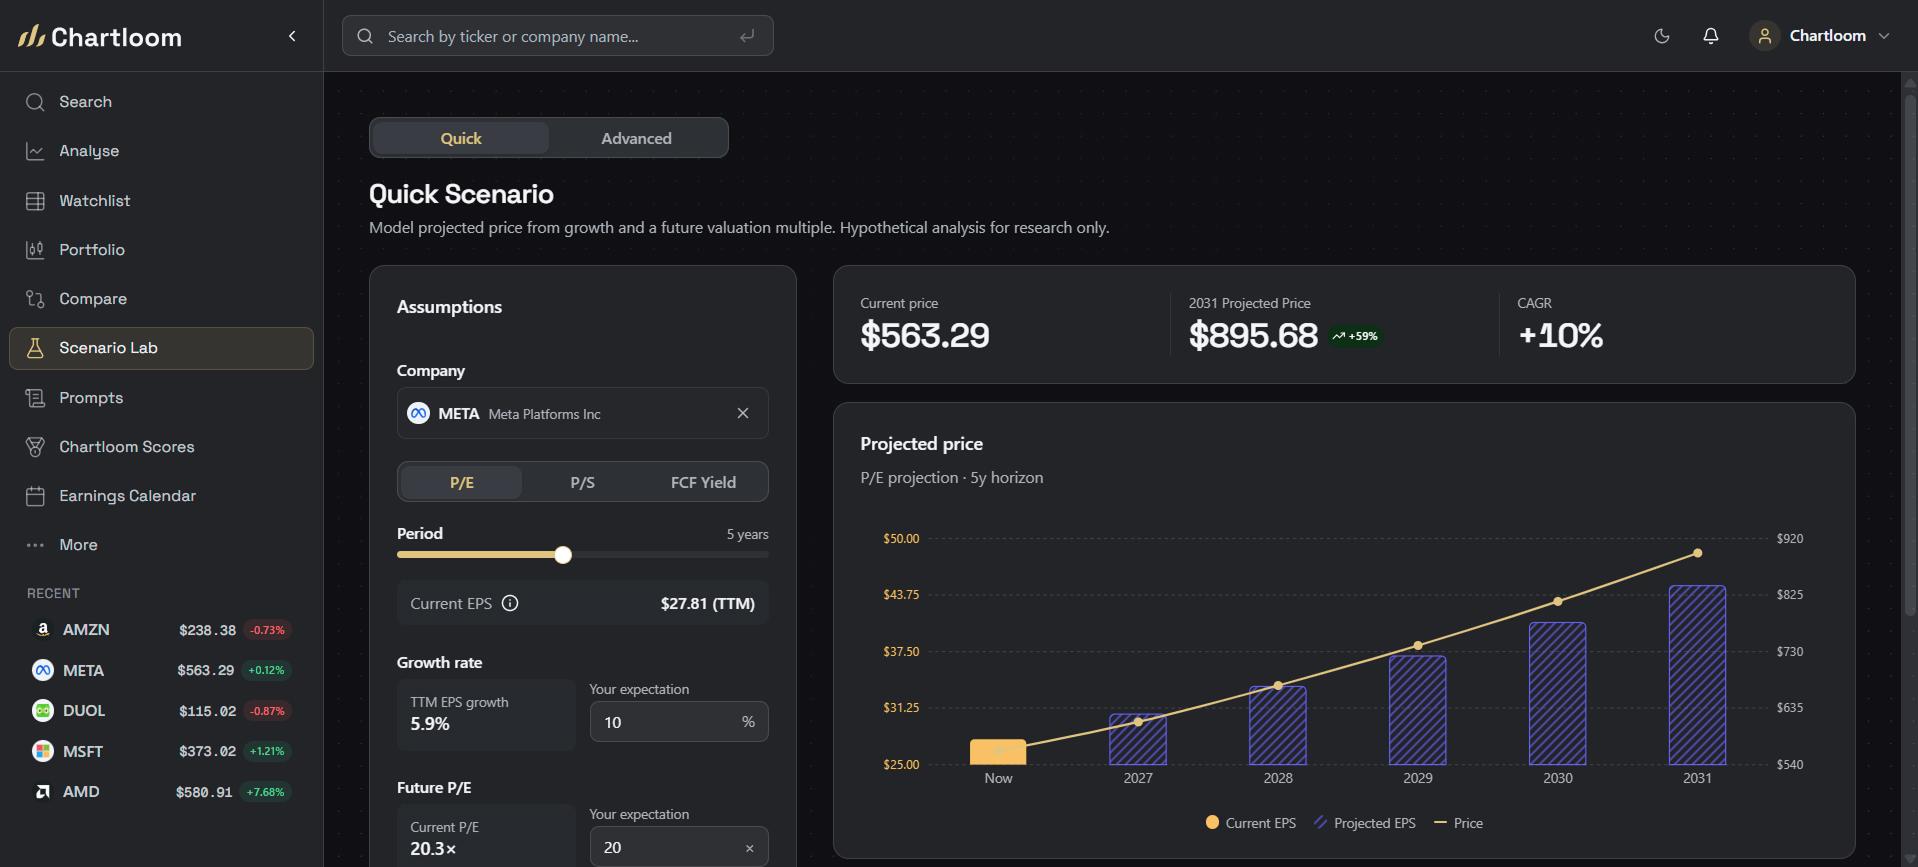
Research is stronger when it accounts for a range of outcomes rather than a single estimate. Scenario Lab makes it straightforward to test how assumptions change the picture. Adjust growth, margins, valuation multiples, FCF Yield, share count, or optional DCF inputs, and watch the estimated outcome update across bull, base, and bear cases. Quick mode handles a fast P/E, P/S, or FCF Yield check; Advanced mode adds growth paths, margin targets, exit multiples, and DCF assumptions.
Why scenarios help
A single outcome can hide the real range of possibilities. Building a bear case (for example, lower margins or slower growth) alongside a base and bull case shows how sensitive the estimated fair value is to the assumptions. Scenario Lab uses the same company data as the rest of Chartloom, so the model starts from real figures before assumptions are layered on. Saved scenarios can be revisited when new earnings or estimates change the view.
Putting the workflow together
Used in order, the six steps move from a broad understanding of a business to a tested view of its fundamentals and valuation. The AI summary frames the story; the charts confirm the trends; valuation ranges add context; insiders and analysts add outside perspective; peer comparison benchmarks the numbers; and Scenario Lab stress-tests the assumptions. Because these views live under one ticker, it is easier to keep the research consistent across companies.
Notes can be kept beside the ticker data throughout, so observations from each step stay attached to the company. As with any tool, the output supports research rather than replacing the need to read filings and form an independent opinion.
Key takeaways: snapshot
- Start with the story: AI Summaries explain what the company does, how it earns, and its key risks.
- Confirm the trend: charts show revenue, margins, and cash flow over time, not a single snapshot.
- Value in context: valuation charts show where a metric sits in its historical range.
- Add perspective: insider activity, ownership, and analyst estimates are extra context, not conclusions.
- Benchmark peers: compare up to 3 stocks on valuation, growth, and margins. That tool is on Pro and the 14-day trial.
- Test assumptions: Scenario Lab models bull, base, and bear cases from real company data.