US Stock Research Dashboard · 5,000+ Tickers
One Stock Research Dashboard From SEC Filings to Valuation
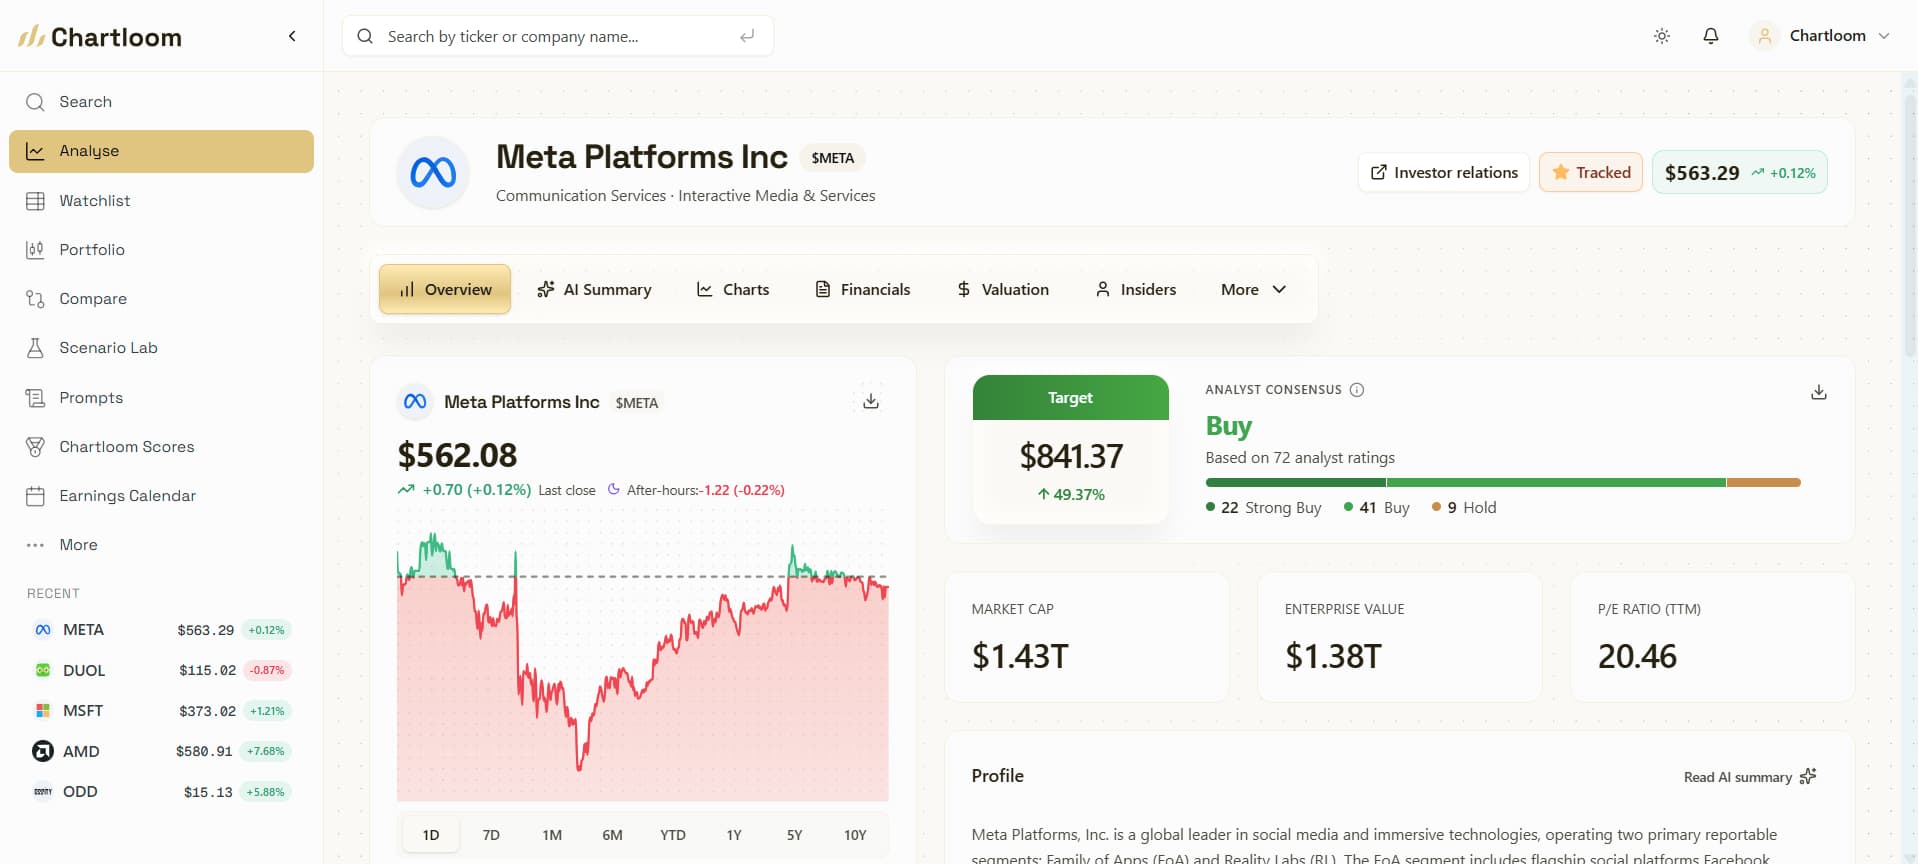
Researching a US stock across scattered filings, statement tables, and spreadsheets wastes hours. Open any of 5,000+ tickers to read AI 10-K and 10-Q summaries, 35+ years of annual financials, 100+ charts, valuation multiples, and notes on one screen.
Free on 5,000+ US stocks · No signup or credit card required
- Everything under one ticker
- Instant business overview
- AI-distilled SEC filings


5,000+
US Stocks
100+
Charts & Research Tools
35+ Years
Financial History
Connected tools inside every ticker hub
Jump directly from any ticker's overview into deeper charting, filing summaries, side-by-side peer comparisons, or scenario modelling.
Research value
From scattered filing tabs to one stock research dashboard
Built for investors who want the important context first: what changed, where the numbers are moving, and which follow-up questions deserve deeper research.
Everything under one ticker
Explore complete financial history, AI filing takeaways, valuation metrics, ownership, analyst sentiment, and notes without switching tabs.
Instant business overview
Start with key fundamentals, revenue drivers, and quick performance snapshots to see if a stock warrants deeper investigation.
AI-distilled SEC filings
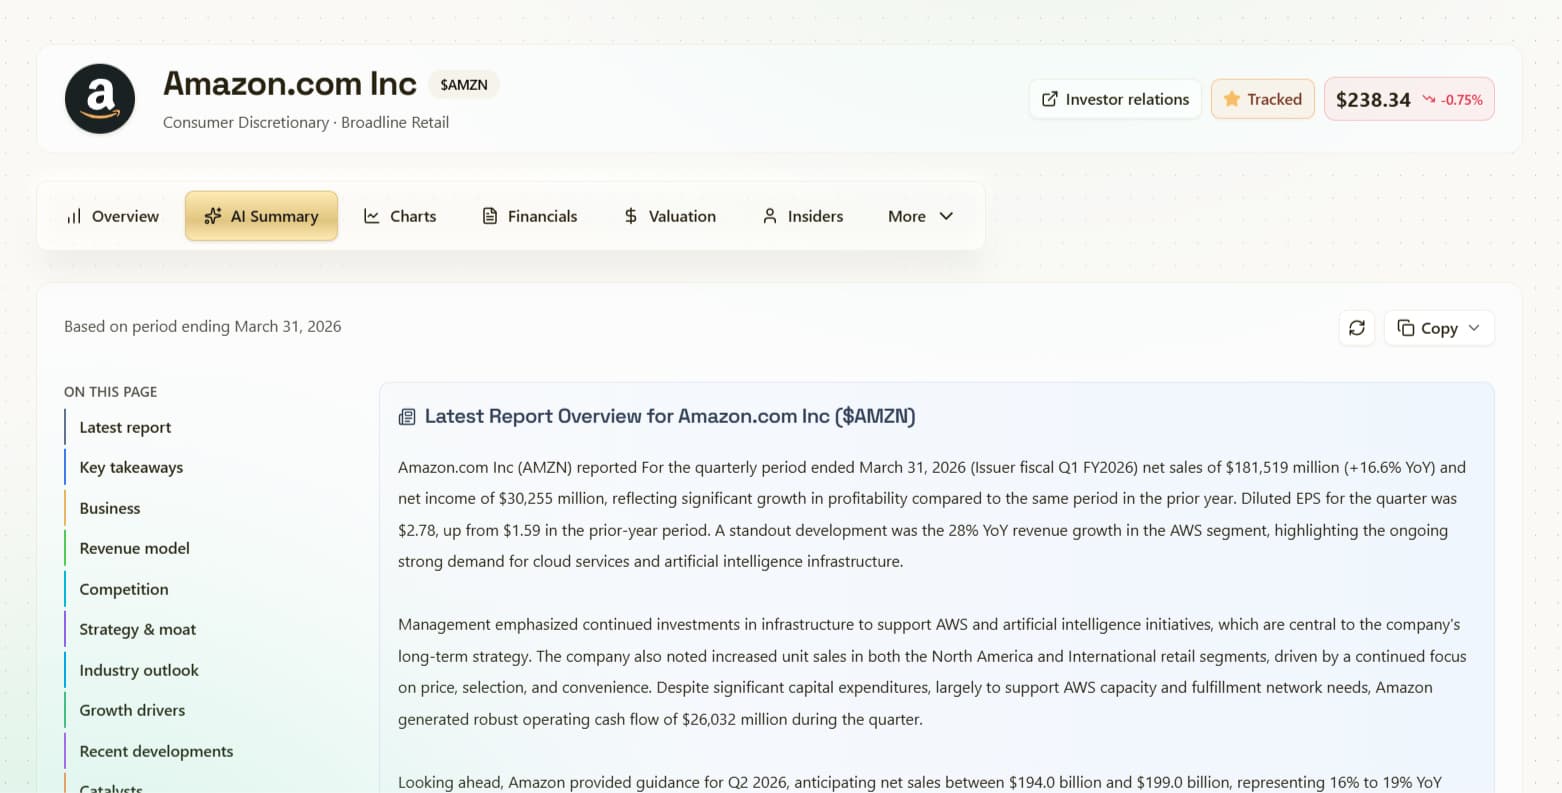
Scan plain-English summaries of 10-K and 10-Q filings, extracting revenue models, growth catalysts, and hidden risk factors in seconds.
Visual financial statements
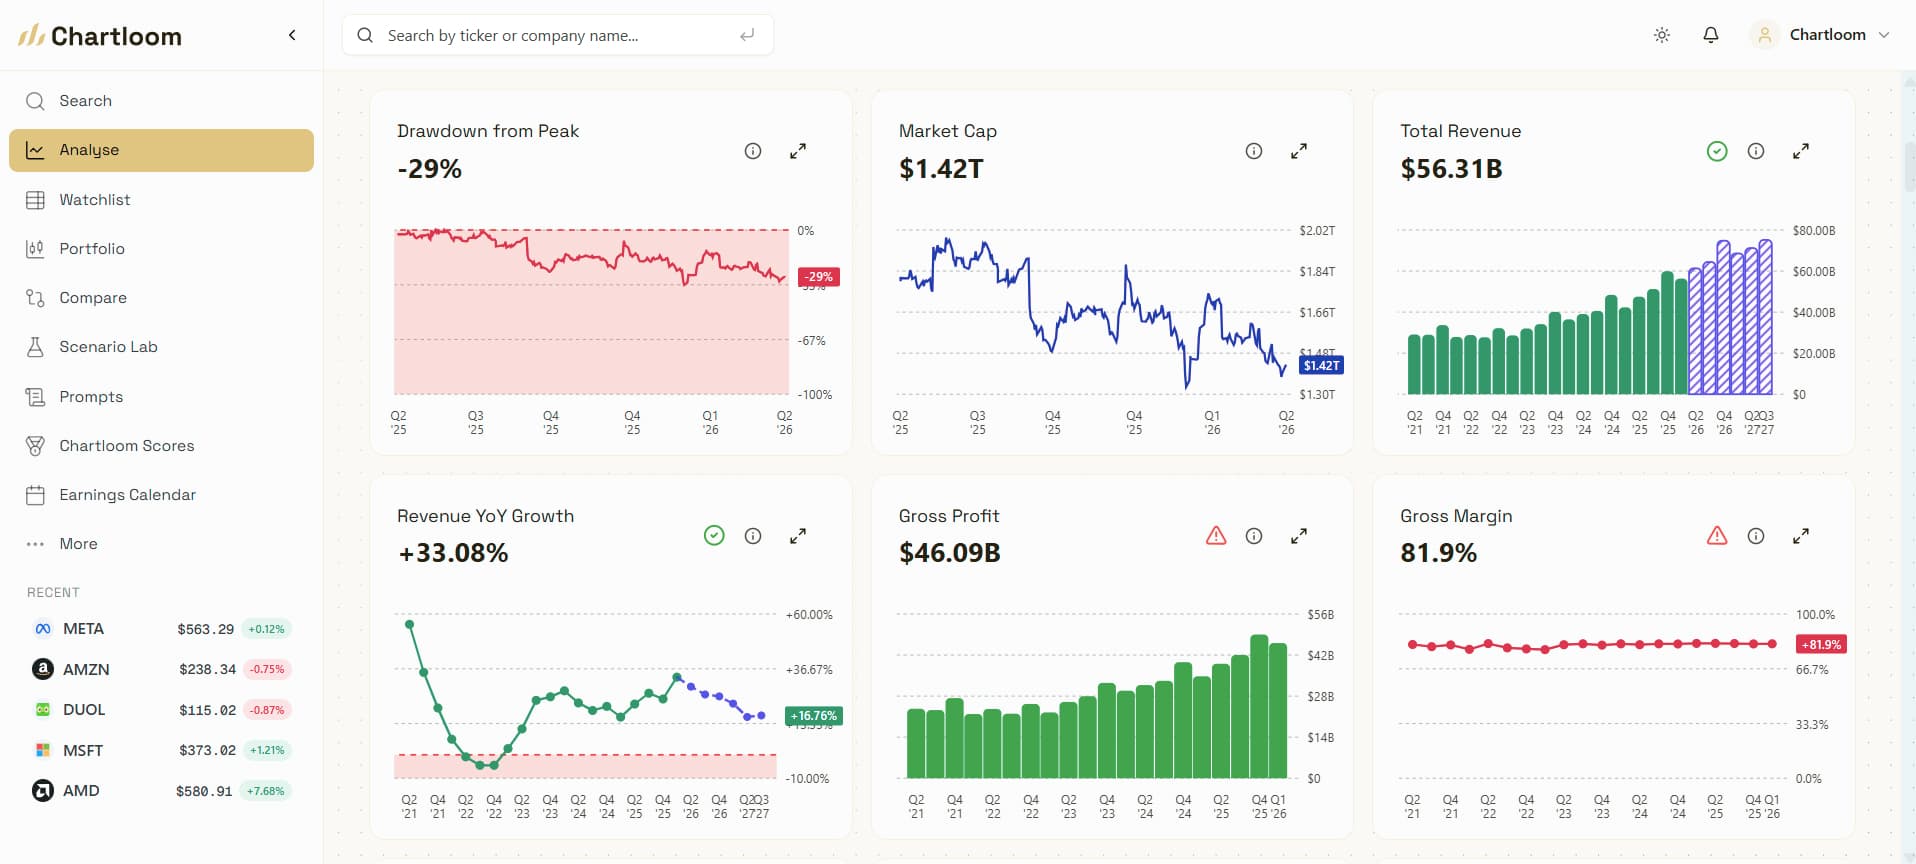
Translate 35+ years of raw financial statements into intuitive multi-year charts for revenue, operating margins, cash flows, and balance sheet health.
Try Ticker Dashboard with a 14-day free Pro trial
Free plan available · No credit card required · Instant access to 5,000+ US stocks
Benefits
What Ticker Dashboard helps with
Practical research jobs: move faster, keep context together, and decide what deserves deeper analysis.
Everything under one ticker
Explore complete financial history, AI filing takeaways, valuation metrics, ownership, analyst sentiment, and notes without switching tabs.
Instant business overview
Start with key fundamentals, revenue drivers, and quick performance snapshots to see if a stock warrants deeper investigation.
AI-distilled SEC filings
Scan plain-English summaries of 10-K and 10-Q filings, extracting revenue models, growth catalysts, and hidden risk factors in seconds.
Visual financial statements
Translate 35+ years of raw financial statements into intuitive multi-year charts for revenue, operating margins, cash flows, and balance sheet health.
Valuation multiples & expectations
Track historical P/E, P/S, EV/EBITDA, and Free Cash Flow Yield alongside consensus Wall Street analyst estimates.
Integrated research notes
Keep your investment thesis, key questions, and earnings observations saved directly beside the company's real data.
Workflow
How to use it in research
Start with a ticker, use the feature for the specific research job, then jump into the next Chartloom view when more context is needed.
Search any US ticker
Enter a ticker symbol or company name to open its complete research dashboard.
Scan the fundamentals
Review the Overview and AI Summary to understand how the business makes money, its growth rate, and key risks.
Dive into the numbers
Explore interactive charts, 35+ years of financial statements, valuation trends, insider transactions, and analyst estimates.

How to
How to research a US stock from SEC filings to valuation in one place
A complete stock research workflow moves from what the business does, to what the financial statements show, to how the stock is priced against its own history. On Chartloom, every step lives under one ticker symbol for 5,000+ US-listed companies.
- Read the business model and risks first. Open the ticker's AI Summary tab to review plain-English takeaways from the latest 10-K and 10-Q filings, including revenue drivers, moat, and Item 1A risk factors.
- Check multi-year financial statements and trends. Switch to Financials and Charts to inspect up to 35+ years of annual and 15 years of quarterly revenue, operating margins, free cash flow, debt, and share count (8 core charts and about 10 years of annual data are free; full history is on Pro).
- Compare current valuation multiples to history. Open Valuation and Estimates to review trailing and forward P/E, P/S, EV/EBITDA, and free cash flow yield alongside consensus revenue and EPS estimates.
- Stress-test the thesis and log your notes. Open Scenario Lab (on Pro and the 14-day trial) to model bull, base, and bear cases from the company's reported baseline, and save questions in the Notes tab.
Because every tab shares the same standardized SEC and market data, you can move from filing text to valuation models without copying numbers into a spreadsheet.
Product view
Every step of ticker research in one workspace
Start with Overview and the AI Summary to see how the business makes money. Then check 35+ years of annual financial statements, 15 years of quarterly data, interactive charts, valuation multiples, and insider activity on the same ticker page.

FAQ
Frequently asked questions
Useful details about Ticker Dashboard, data coverage, and how the feature fits into a research workflow.
What is the Ticker Dashboard in Chartloom?
The Ticker Dashboard is the central research hub for any of 5,000+ US stocks. It organizes company data into dedicated tabs: Overview, AI Summary, Charts, Financials, Valuation, Insiders, Estimates, News, Flow, and Notes.
How do I research a stock efficiently in Chartloom?
Start with the Overview and AI Summary for a high-level business grasp. Then check Charts for visual multi-year trends, Financials for official statements, Valuation for historical multiples, and Analysts for consensus revenue and earnings forecasts.
What financial statements are available?
Chartloom provides income statements, balance sheets, and cash flow statements with up to 35+ years of annual history and 15 years of quarterly data, sourced directly from standardized market feeds and official SEC filings.
Can Chartloom replace multiple finance tools and spreadsheets?
For fundamental stock analysis, yes. Chartloom unifies financial statements, visual charts, filing summaries, multiples, consensus estimates, insider tracking, and notes so investors don't need to juggle multiple tabs.
What stocks are covered?
Chartloom covers 5,000+ US-listed equities across major exchanges (NYSE, NASDAQ), providing standardized financial data and AI filing summaries.
How often is the data updated?
Valuation ratios and market data update daily, while financial statements, earnings results, and filing summaries update automatically as companies report new quarterly (10-Q) and annual (10-K) filings.