AI 10-K & 10-Q Filing Summaries · 5,000+ US Stocks
Read Plain-English AI Summaries of SEC 10-K and 10-Q Filings
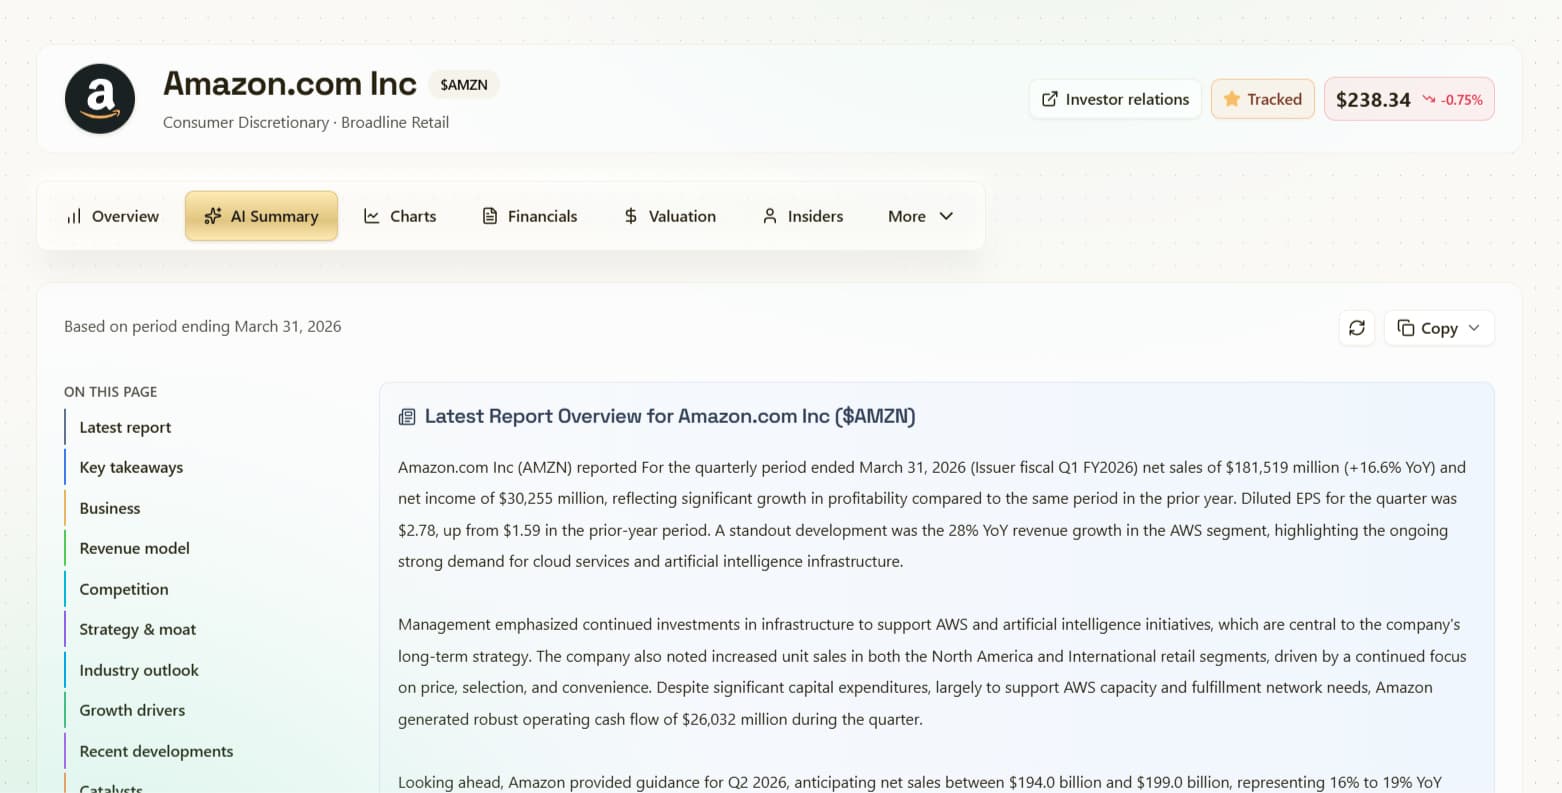
Annual 10-K and quarterly 10-Q filings run over 100 pages of dense legal and accounting text. Chartloom summarizes official SEC EDGAR filings for 5,000+ US stocks into plain-English business overviews (free) and deeper moat, catalyst, and Item 1A risk analysis (on Pro).
Free on 5,000+ US stocks · No signup or credit card required
- Key takeaways in 60 seconds
- Business model & revenue drivers
- Disclosed risk factors extracted


5,000+
US Stocks
100+
Charts & Research Tools
35+ Years
Financial History
Research value
From 100-page 10-K and 10-Q filings to plain-English business takeaways
Built for investors who want the important context first: what changed, where the numbers are moving, and which follow-up questions deserve deeper research.
Key takeaways in 60 seconds
Get 3 to 5 core bullet points highlighting the company's financial condition, recent quarterly performance, and business momentum.
Business model & revenue drivers
Understand how the company makes money, its core products, target customer segments, and competitive advantages.
Disclosed risk factors extracted
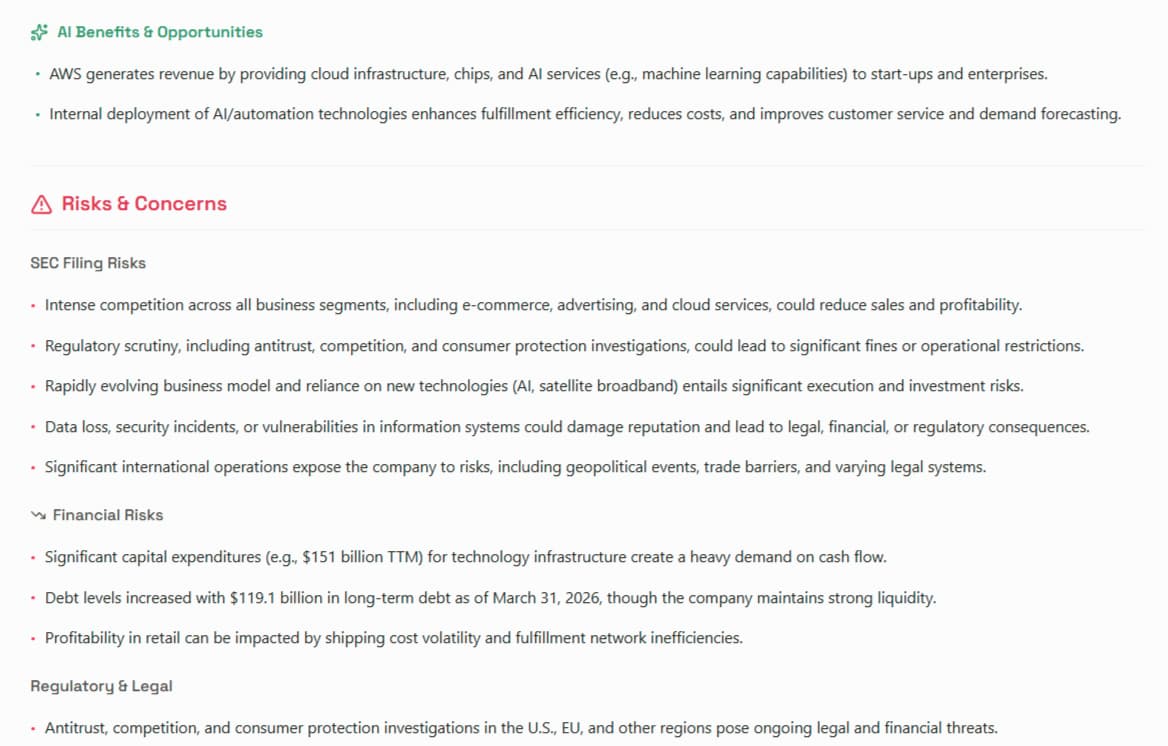
Surface Item 1A Risk Factors from official SEC filings, highlighting debt obligations, customer concentration, and regulatory challenges.
Grounded in official SEC filings
Every AI summary is grounded directly in official SEC EDGAR 10-K and 10-Q text and verified financial statement data.
Try AI Summaries with a 14-day free Pro trial
Free plan available · No credit card required · Instant access to 5,000+ US stocks
Benefits
What AI Summaries helps with
Practical research jobs: move faster, keep context together, and decide what deserves deeper analysis.
Key takeaways in 60 seconds
Get 3 to 5 core bullet points highlighting the company's financial condition, recent quarterly performance, and business momentum.
Business model & revenue drivers
Understand how the company makes money, its core products, target customer segments, and competitive advantages.
Disclosed risk factors extracted
Surface Item 1A Risk Factors from official SEC filings, highlighting debt obligations, customer concentration, and regulatory challenges.
Grounded in official SEC filings
Every AI summary is grounded directly in official SEC EDGAR 10-K and 10-Q text and verified financial statement data.
Plain English clarity
Complex legal, operational, and accounting jargon is translated into straightforward, educational summaries.
Jump straight into the filing
Use the summary to identify the most critical business topics, then navigate into the full SEC filing text where deeper review is needed.

Workflow
How to use it in research
Start with a ticker, use the feature for the specific research job, then jump into the next Chartloom view when more context is needed.
Search any US company
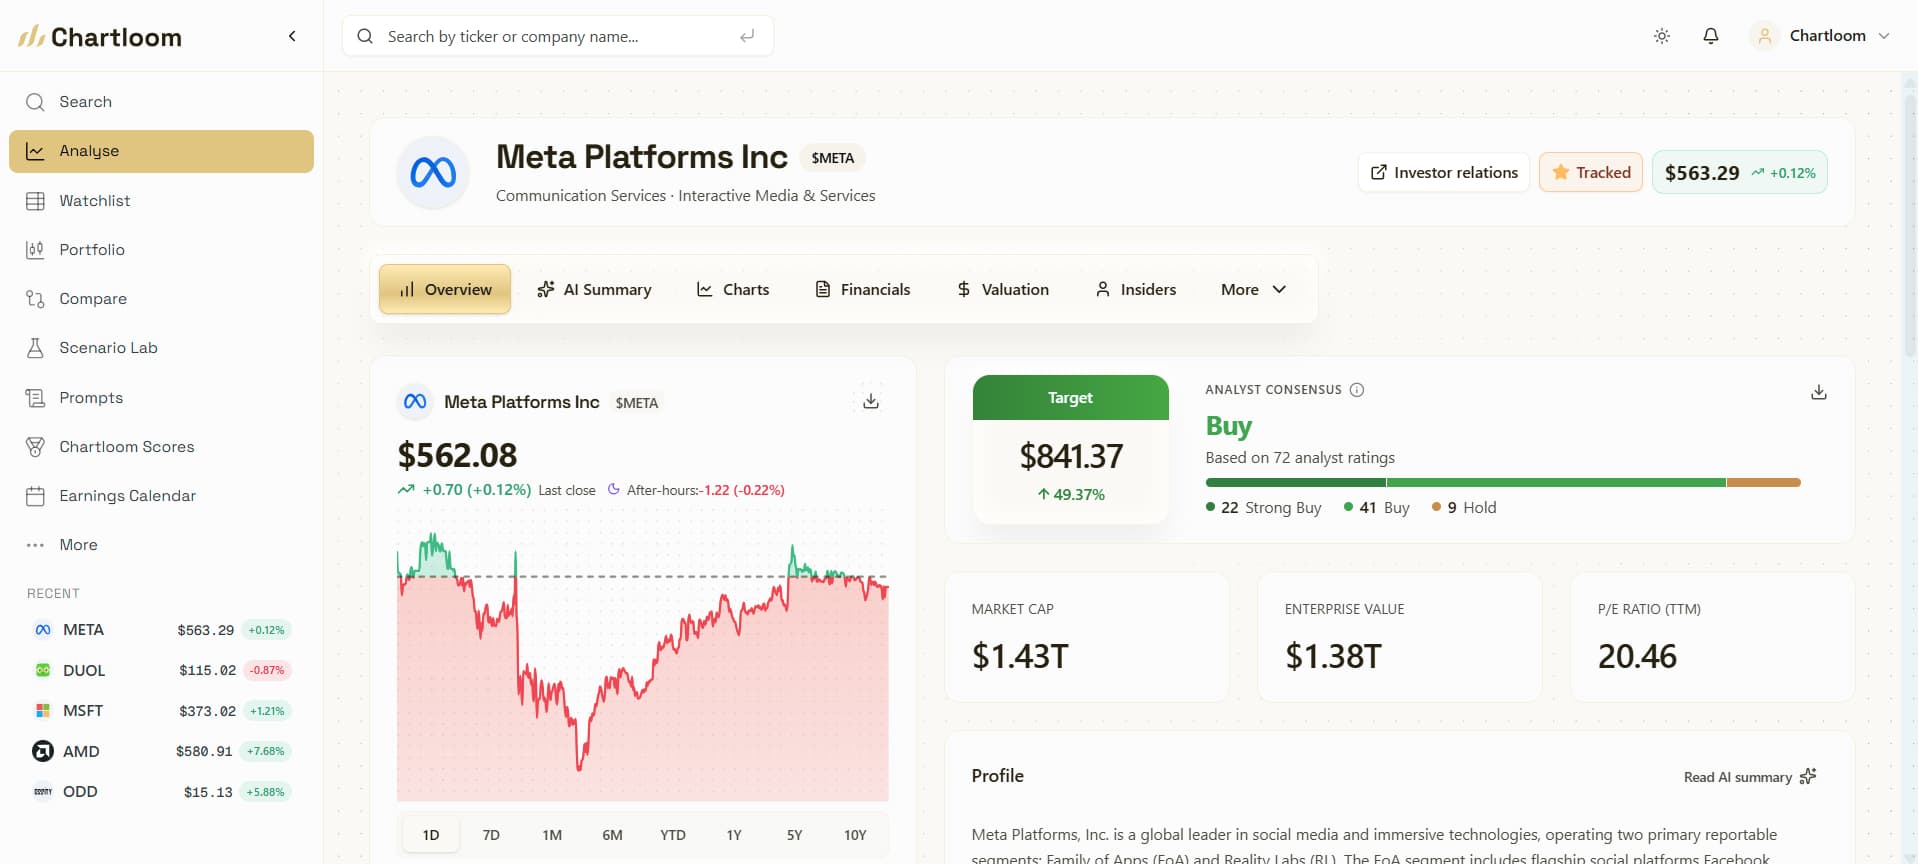
Enter a ticker symbol or company name to open its analysis dashboard.
Read structured AI takeaways
Review business overview, revenue drivers, recent developments, competitive moats, and disclosed risk factors.
Verify with the numbers
Cross-reference the AI summary directly against official 35-year financial statements and interactive charts.

Product view
Structured summaries from filings, analysts, ownership and insiders
Key takeaways, business overview, revenue model, competitive position, growth drivers, recent developments, strengths, and risks in plain English. Use it to decide which parts of the filing to read in depth.
FAQ
Frequently asked questions
Useful details about AI Summaries, data coverage, and how the feature fits into a research workflow.
Where can I find simplified summaries of 10-K and 10-Q filings?
Chartloom provides plain-English AI summaries of official SEC 10-K annual reports and 10-Q quarterly filings across 5,000+ US stocks. Anyone can read the AI business overview on the Free plan with no credit card, and Pro ($10/month, with a 14-day free trial) adds competitive moat analysis, growth catalysts, and extracted Item 1A risk factors.
What is included in each AI SEC filing summary?
Each summary synthesizes official 10-K and 10-Q SEC filings into structured sections: executive takeaways, business overview, revenue mechanics, growth catalysts, competitive position, recent quarterly developments, and Item 1A Risk Factors.
Are Chartloom AI summaries grounded in real SEC filings?
Yes. Summaries are generated directly from official SEC EDGAR filing text combined with standardized financial statement data and analyst consensus estimates.
Can an AI summary replace reading the complete SEC filing?
AI summaries serve as a fast triage tool to grasp the core narrative, strategic shifts, and main risks. For material investment decisions, investors should verify details in the full 10-K or 10-Q filing.
How frequently are AI summaries updated?
Summaries update automatically whenever a company releases a new quarterly report (10-Q) or annual report (10-K) with the SEC.