Scenario Lab
See what happens when stock assumptions change.
A stock thesis can look strong until key assumptions change. Scenario Lab allows investors to stress-test their models in seconds. Adjust revenue growth rates, profit margins, exit multiples (P/E, P/S, FCF Yield), share dilution, and DCF inputs to instantly see how fair value estimates respond.
- Model multiple outcomes
- No fragile spreadsheet formulas
- Quick and Advanced modeling modes


5,000+
US Stocks
100+
Charts & Research Tools
35+ Years
Financial History
Research value
From fragile spreadsheets to clear bull, base, and bear valuation models.
Built for investors who want the important context first: what changed, where the numbers are moving, and which follow-up questions deserve deeper research.
Model multiple outcomes
A single growth forecast rarely unfolds as planned. Build Bull, Base, and Bear scenarios to understand upside potential and downside risk.
No fragile spreadsheet formulas
Skip broken formulas and manual formatting. Adjust assumptions with intuitive inputs while Chartloom automatically calculates the valuation math.
Quick and Advanced modeling modes
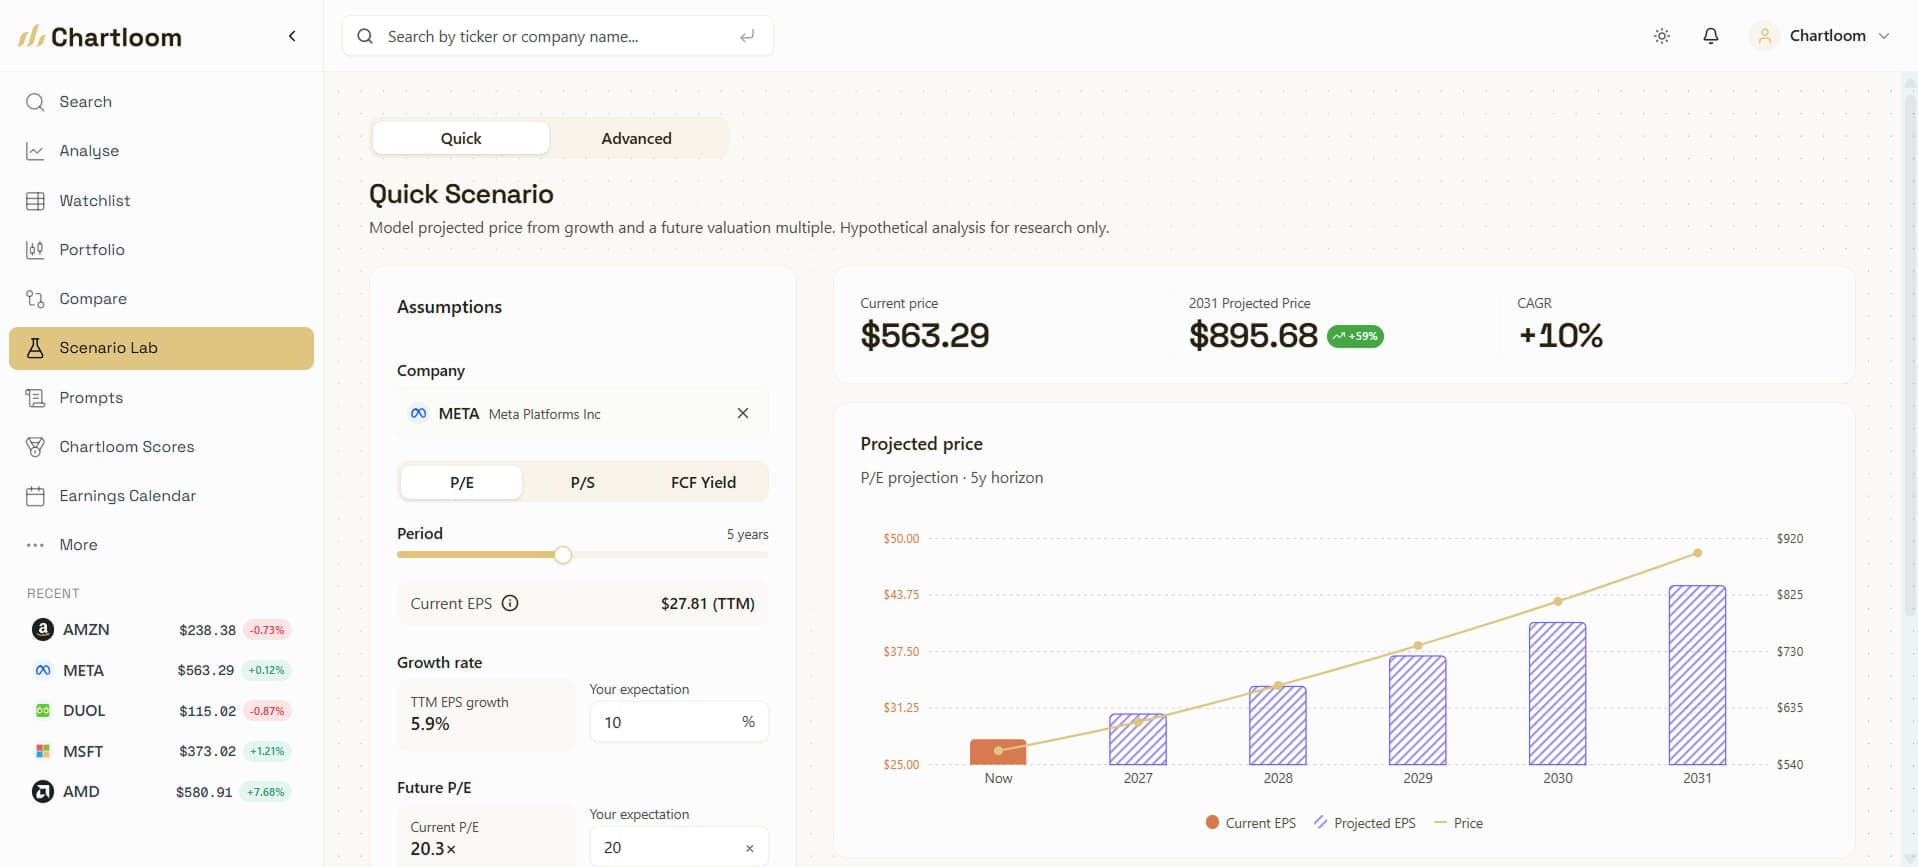
Use Quick Mode for fast multiple-based checks (P/E, P/S, Free Cash Flow Yield). Switch to Advanced Mode for multi-stage growth paths, margin shifts, and Discounted Cash Flow (DCF) analysis.
Built on real financial data
Models automatically pull in the company's real historical financials and current share counts, starting from verified baseline data.
Try Scenario Lab with a 14-day free Pro trial
Free plan available · No credit card required · Instant access to 5,000+ US stocks
Benefits
What Scenario Lab helps with
Practical research jobs: move faster, keep context together, and decide what deserves deeper analysis.
Model multiple outcomes
A single growth forecast rarely unfolds as planned. Build Bull, Base, and Bear scenarios to understand upside potential and downside risk.
No fragile spreadsheet formulas
Skip broken formulas and manual formatting. Adjust assumptions with intuitive inputs while Chartloom automatically calculates the valuation math.
Quick and Advanced modeling modes
Use Quick Mode for fast multiple-based checks (P/E, P/S, Free Cash Flow Yield). Switch to Advanced Mode for multi-stage growth paths, margin shifts, and Discounted Cash Flow (DCF) analysis.
Built on real financial data
Models automatically pull in the company's real historical financials and current share counts, starting from verified baseline data.
Save and revisit models
Save your custom valuation models and update them whenever the company releases new quarterly earnings or revised guidance.
Connected to ticker research
Scenario Lab sits directly beside charts, financial statements, AI filing summaries, and notes for a seamless workflow.

Workflow
How to use it in research
Start with a ticker, use the feature for the specific research job, then jump into the next Chartloom view when more context is needed.
Select a stock
Open Scenario Lab from any company research hub or directly from the tools menu.
Choose Quick or Advanced mode
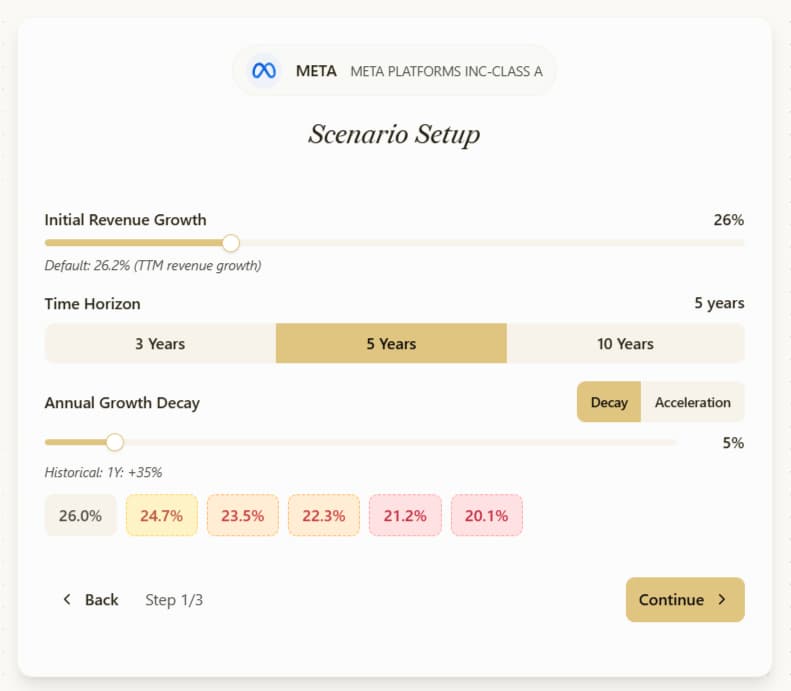
Use Quick Mode for fast multiple-based valuation checks. Use Advanced Mode to customize growth curves, margins, share counts, and DCF discount rates.
Compare Bull, Base, and Bear cases
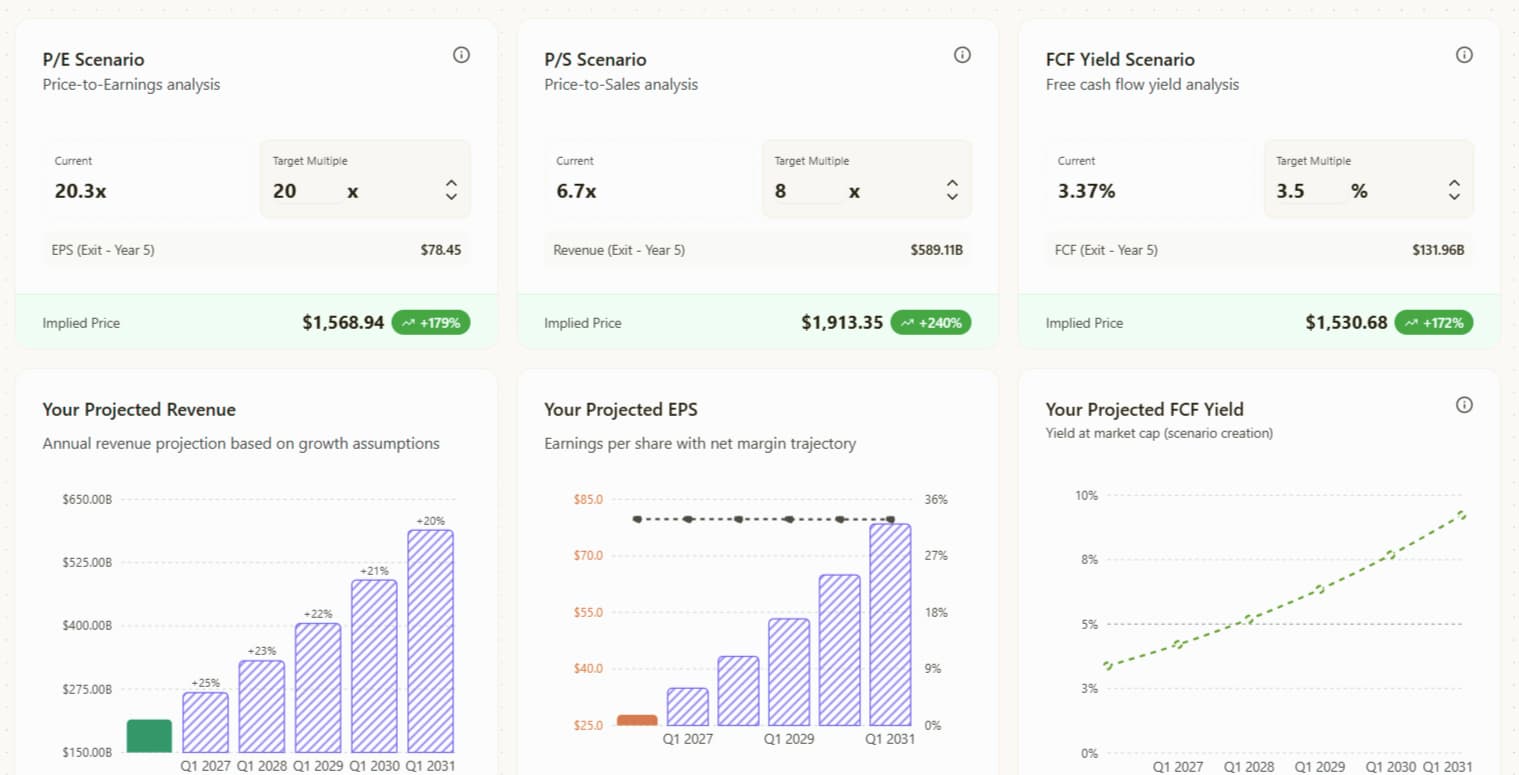
Adjust your expectations and see the estimated returns and fair values calculate automatically.
How to
How to model bull, base and bear scenarios for a stock
A bull, base and bear model starts from one base case built on reported numbers, then changes a few linked drivers to build the other two cases. In Chartloom's Scenario Lab, the company's latest SEC filing data, TTM revenue and share count load automatically, so each case starts from the same baseline.
- Set the base case. Pick a ticker, choose a forecast horizon, and enter a growth rate and exit multiple (P/E, P/S or free cash flow yield) close to the company's recent record.
- Change only the drivers that matter. For the bear case, lower growth or compress margins. For the bull case, test faster growth or a higher exit multiple. Leave everything else unchanged.
- Add dilution and DCF inputs in Advanced Mode. Adjust gross and net margins, share buybacks or dilution, WACC, terminal growth, tax rate, CapEx and working capital.
- Review the result for each case. Scenario Lab shows the price that follows from those assumptions and the percentage change versus the current price, so you can see which assumption moves the result most.
Scenario Lab outputs are illustrative sensitivity analysis. They show how a valuation responds to your assumptions and are not forecasts, price targets or advice.

Product view
Quick checks and deeper models in one lab
Use Quick mode when a simple valuation multiple check is enough. Switch to Advanced mode when your research requires multi-year growth curves, margin targets, share buyback assumptions, or a full DCF model.
FAQ
Frequently asked questions
Useful details about Scenario Lab, data coverage, and how the feature fits into a research workflow.
How do I model bull, base, and bear cases for a stock?
Open Scenario Lab, select a ticker, and set distinct assumptions for each scenario. For example, a base case might assume moderate revenue growth, a bear case models margin compression, and a bull case tests market share expansion or higher terminal valuation multiples.
What financial metrics can I adjust in Scenario Lab?
In Quick Mode, adjust forecast horizon, revenue growth rates, and exit valuation multiples (P/E, P/S, or Free Cash Flow Yield). In Advanced Mode, adjust annual growth decay/acceleration, gross and net profit margins, share buybacks/dilution, and Discounted Cash Flow (DCF) inputs such as WACC and terminal growth.
Can Scenario Lab replace complex valuation spreadsheets?
For fundamental stock modeling, yes. Scenario Lab eliminates the need to manually build formula-heavy DCF and multiple-based spreadsheets, reducing modeling errors and saving hours of setup time.
Does Scenario Lab include Discounted Cash Flow (DCF) modeling?
Yes. Advanced Mode supports DCF inputs including Weighted Average Cost of Capital (WACC), terminal growth rates, tax assumptions, CapEx percentages, and working capital changes.
What is the best stock valuation tool?
No single tool suits every investor. Judge a valuation tool on three things: does it start from the company's reported numbers, can you change the assumptions yourself, and does it show more than one outcome? Scenario Lab, part of Chartloom Pro, loads the latest filing data and lets you test bull, base and bear cases with exit multiples or DCF inputs.
What are the top 3 valuation methods?
The three most common are discounted cash flow (DCF), comparable company multiples and precedent transactions. DCF values a business on its expected future cash flows. Multiples such as P/E, P/S and EV/EBITDA compare it with similar companies. Precedent transactions use prices paid in past acquisitions. Scenario Lab covers the first two, with exit multiples in Quick Mode and DCF inputs in Advanced Mode.
How do you run a DCF with historical metrics?
Start from the company's own history before setting DCF inputs. Chartloom Pro charts 35+ years of annual financials and 15 years of quarterly financials, so growth, margin and share count assumptions can be checked against past cycles. Then enter WACC, terminal growth, tax, CapEx and working capital in Scenario Lab's Advanced Mode. Each case shows the price that follows from those assumptions and the percentage change versus the current price.
What baseline data does Scenario Lab use?
Scenario Lab automatically pulls the latest SEC filing data, balance sheet figures, trailing twelve months (TTM) revenue, and shares outstanding for the selected ticker.
Is Scenario Lab included in the Pro plan?
Yes. Scenario Lab is fully included in the Chartloom Pro plan at $10/month, providing unlimited scenario saves and unrestricted access to all modeling features.