Compare
Compare stocks without opening ten tabs.
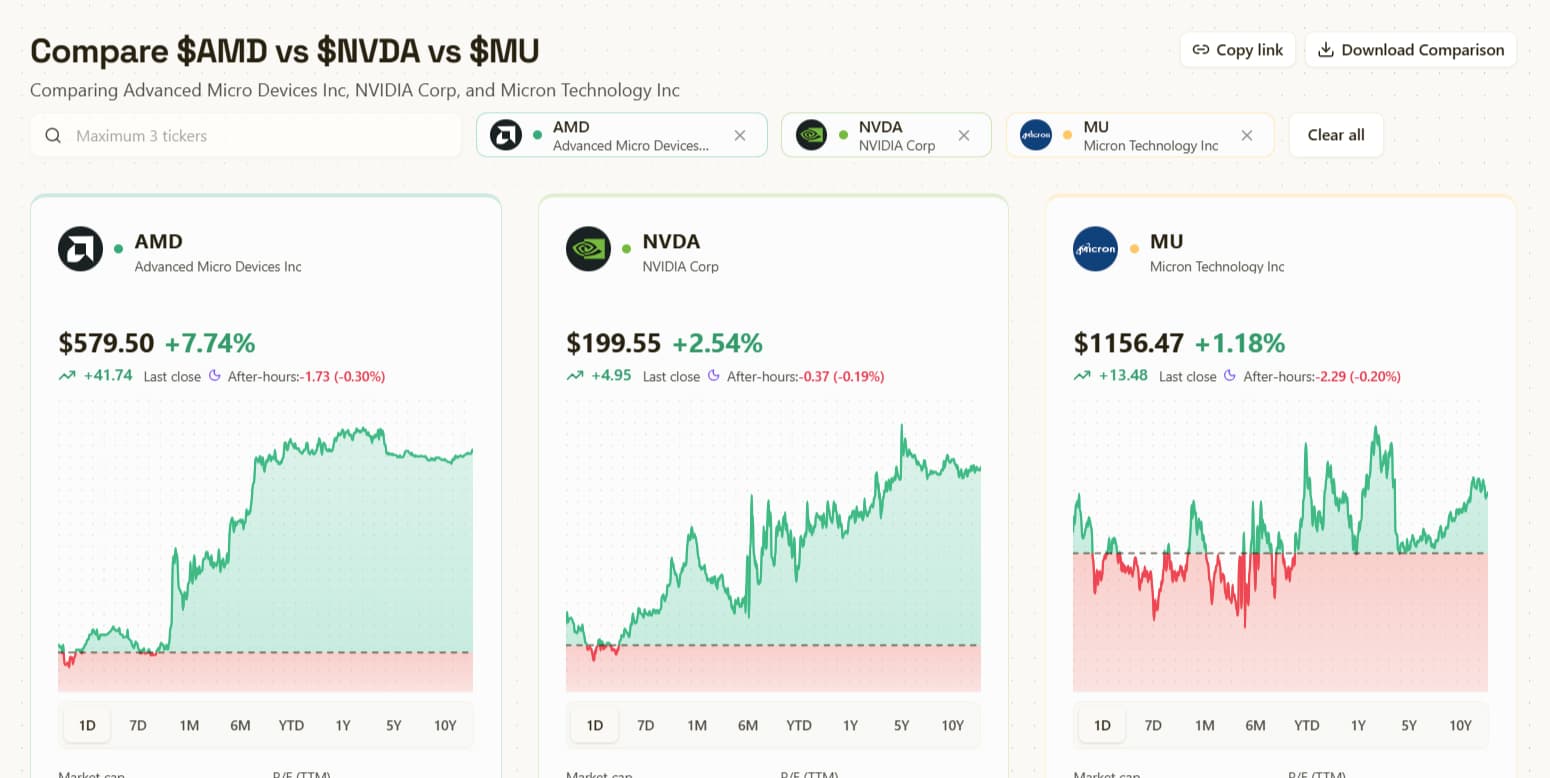
Evaluating competing companies often turns into a spreadsheet headache. One business has faster revenue growth, while another boasts higher operating margins or a lower valuation multiple. Chartloom puts up to 3 stocks side-by-side across standardized fundamentals, metric cards, and charts—making core differences instantly visible.
- Side-by-side fundamentals
- Key valuation & margin comparisons
- Zero manual data entry


5,000+
US Stocks
100+
Charts & Research Tools
35+ Years
Financial History
Research value
From scattered numbers to one clear side-by-side view.
Built for investors who want the important context first: what changed, where the numbers are moving, and which follow-up questions deserve deeper research.
Side-by-side fundamentals
Line up two or three companies side-by-side to evaluate competitors, industry leaders, or watchlist candidates on equal footing.
Key valuation & margin comparisons
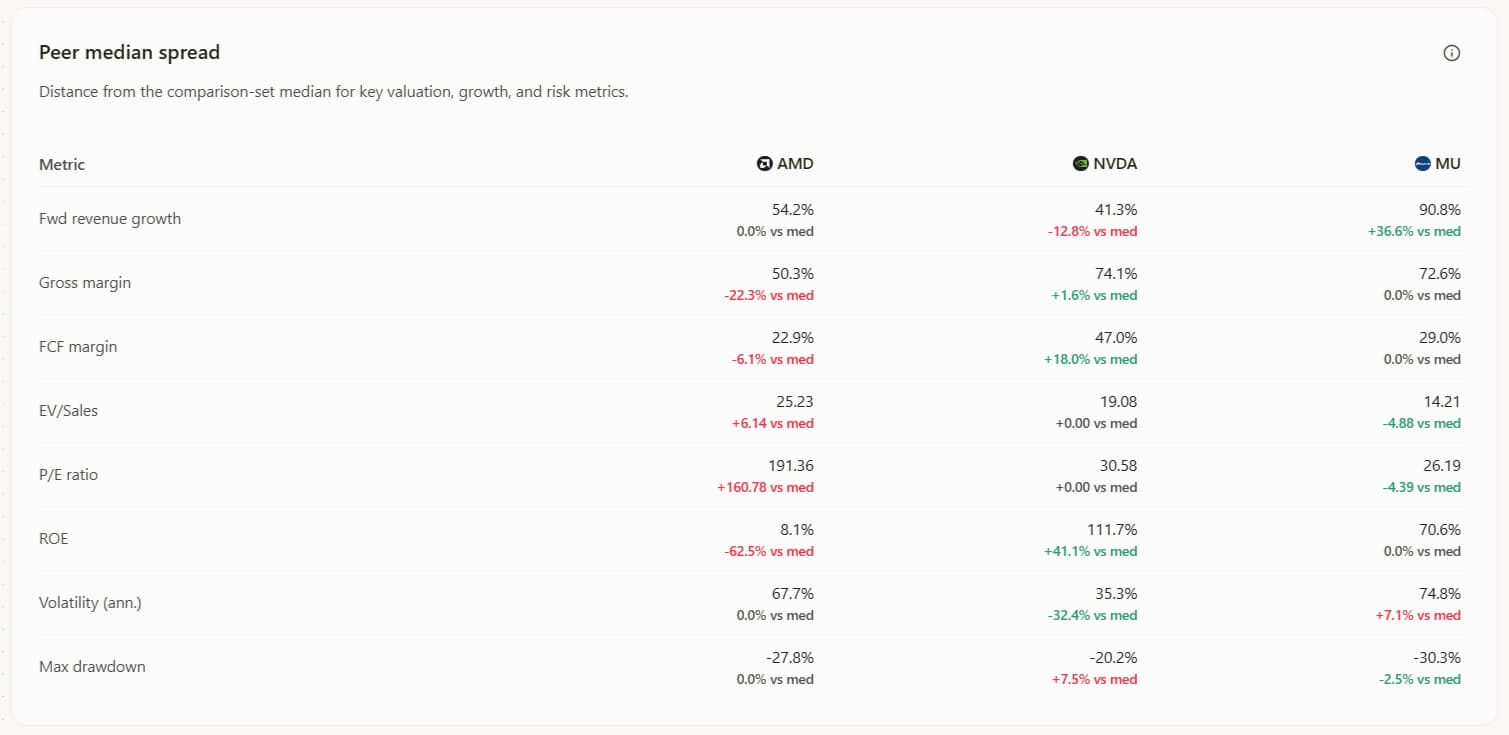
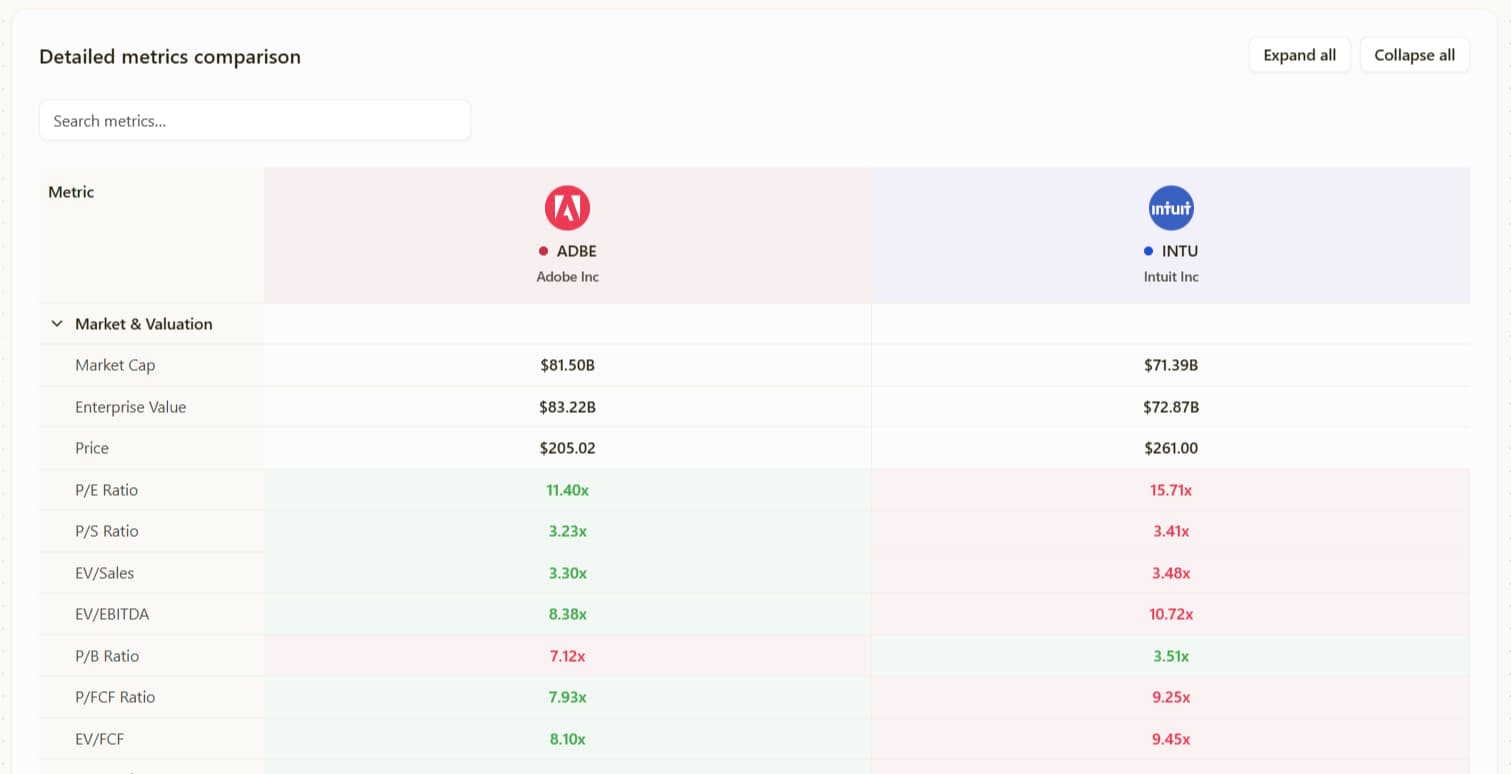
Scan Price-to-Earnings (P/E), Price-to-Sales (P/S), EV/EBITDA, Free Cash Flow Yield, gross margins, and operating margins in one table.
Zero manual data entry
Skip copy-pasting numbers from SEC filings into Excel. All metrics update and align automatically across the same timeframes.
Pre-built industry matchups
Explore popular industry comparisons like NVDA vs TSM, CRWD vs PANW, or AAPL vs MSFT with a single click.
Try Compare with a 14-day free Pro trial
Free plan available · No credit card required · Instant access to 5,000+ US stocks
Benefits
What Compare helps with
Practical research jobs: move faster, keep context together, and decide what deserves deeper analysis.
Side-by-side fundamentals
Line up two or three companies side-by-side to evaluate competitors, industry leaders, or watchlist candidates on equal footing.
Key valuation & margin comparisons
Scan Price-to-Earnings (P/E), Price-to-Sales (P/S), EV/EBITDA, Free Cash Flow Yield, gross margins, and operating margins in one table.
Zero manual data entry
Skip copy-pasting numbers from SEC filings into Excel. All metrics update and align automatically across the same timeframes.
Pre-built industry matchups
Explore popular industry comparisons like NVDA vs TSM, CRWD vs PANW, or AAPL vs MSFT with a single click.
Save & track peer groups
Save your custom comparisons to your account so you can revisit relative performance whenever new quarterly earnings drop.
Seamless deep dive
Click any ticker in the comparison to instantly open its full research hub, 35+ years of charts, AI summaries, or Scenario Lab.
Workflow
How to use it in research
Start with a ticker, use the feature for the specific research job, then jump into the next Chartloom view when more context is needed.
Choose up to 3 stocks
Search for any US tickers or select a curated pair like NVDA vs TSM.
Scan the fundamentals matrix
Review valuation multiples, revenue growth, profit margins, balance sheet health, and Free Cash Flow Yield side by side.
Dive deeper into the winner
Open any company's complete research dashboard to explore filing summaries, interactive charts, and valuation models.

Product view
A cleaner way to compare stock fundamentals
Use Compare when you want a straight answer: which company offers stronger growth, healthier margins, or a more attractive valuation multiple? Add up to 3 stocks, scan the standardized cards, and open any ticker for deep analysis.

FAQ
Frequently asked questions
Useful details about Compare, data coverage, and how the feature fits into a research workflow.
What is a good tool to compare stocks?
A good stock comparison tool lines up companies on the same metrics over the same timeframes, so the differences show without a spreadsheet. Look for valuation multiples, growth and margins in one view. Chartloom Compare puts up to 3 US stocks side by side on P/E, P/S, EV/EBITDA, free cash flow yield, margins and revenue growth. It is on Pro and the 14-day trial, and visitors can preview one comparison.
How do I compare two stocks side by side in Chartloom?
Open Compare, search for up to 3 ticker symbols, and review them in a unified matrix. Chartloom automatically lines up financial metrics, growth rates, margins, and valuation ratios in standardized columns.
How many stocks can I compare at once?
Pro and the 14-day trial can compare up to 3 stocks at once, and those accounts can save comparisons. Visitors can preview one comparison before creating an account. The Free Plan does not include Compare.
What financial metrics can I compare?
Compare includes market capitalization, Trailing and Forward P/E, Forward P/S, EV/EBITDA, Free Cash Flow (FCF) Yield, gross margin, operating margin, revenue growth, and price performance.
Can I compare stocks without using a spreadsheet?
Yes. Compare is designed specifically to eliminate manual spreadsheet data entry by pulling standardized market and filing data into an interactive side-by-side layout.
Are there pre-built stock comparison pages?
Yes. Chartloom offers curated pair pages such as NVDA vs TSM, CRWD vs PANW, and AAPL vs MSFT, which open directly into the interactive comparison tool with those tickers pre-loaded.
Can I save my comparisons?
Yes. Pro and trial accounts can save a custom stock comparison and reopen it as valuation spreads change. The Free Plan does not include saved comparisons.


