


- 5,000+ US stocks
- 8 core charts free (100+ on Pro)
- Plain-English 10-K summaries
- Free forever, no card required
What the Free plan includes
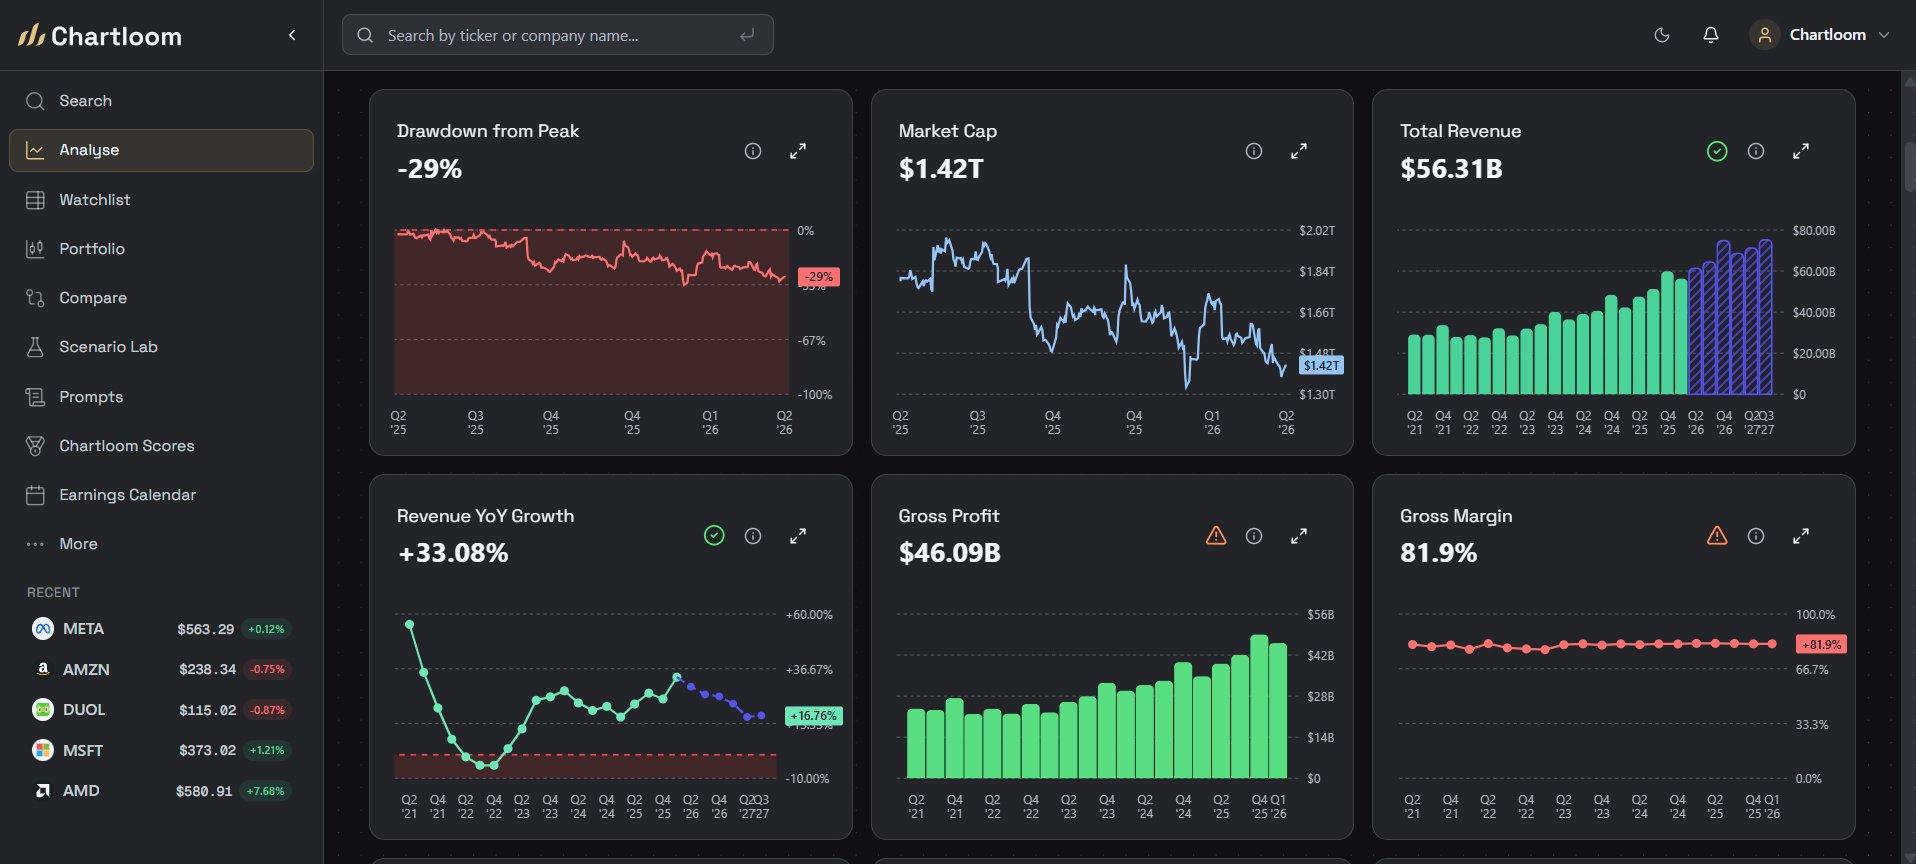
Chartloom gives self-directed investors a free-forever plan covering 5,000+ US stocks. Every free account includes 8 interactive financial charts per company, 10 years of annual chart history, plain-English 10-K business overviews, and superinvestor 13F holdings with no credit card required.
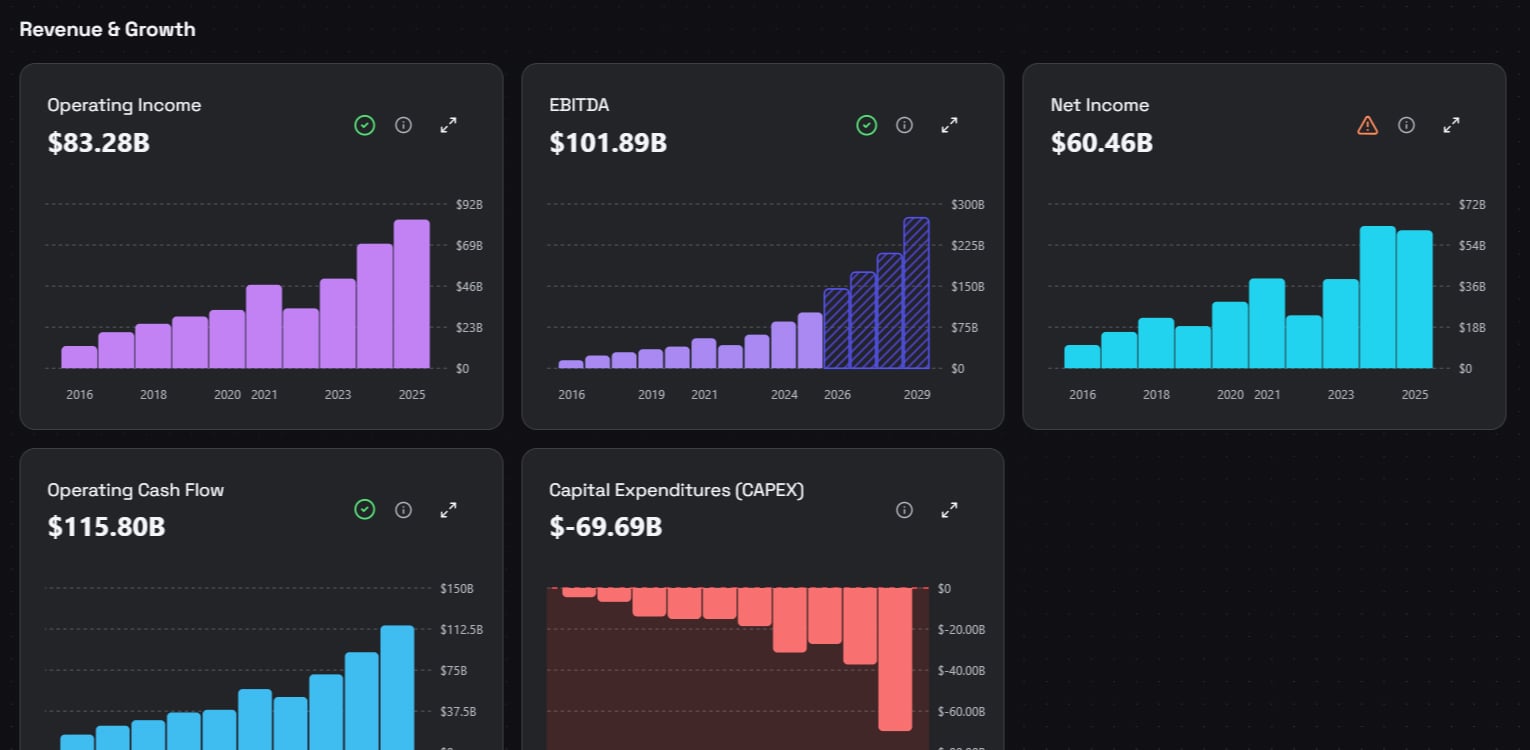
8 financial charts with 10 years of history
Track revenue, operating income, net income, profit margins, free cash flow, debt, and share count across 10 annual years and 8 quarters.
Includes annual and quarterly toggles plus high-resolution PNG chart exports.
Plain-English 10-K business overviews
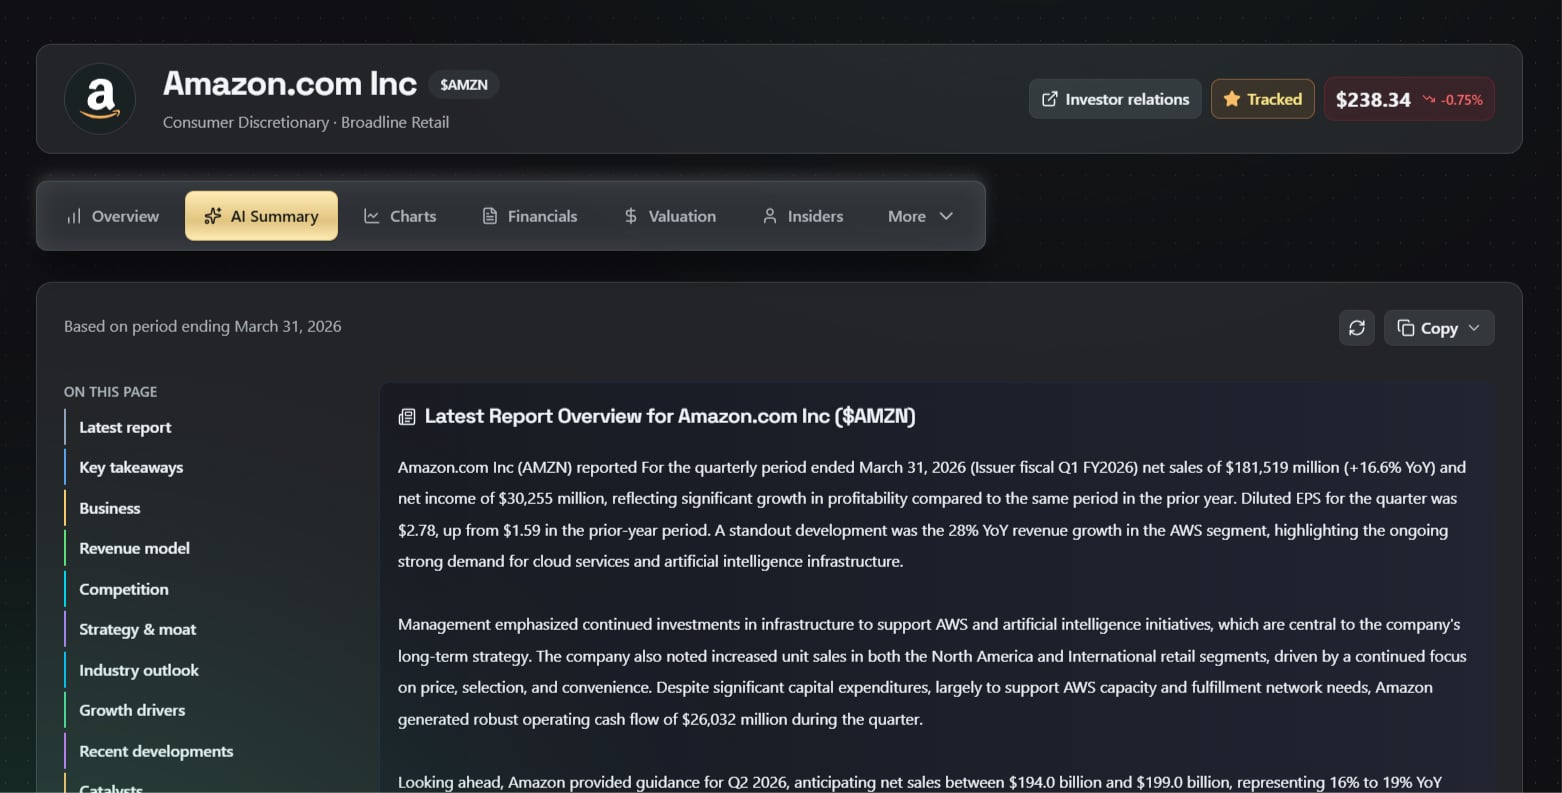
Understand how any US company makes money and what segments drive revenue, summarized directly from official SEC filings.
Grounded in official 10-K and 10-Q disclosures. Pro adds moat and risk factor analysis.
Also included on every Free account
Core valuation multiples
Check historical Market Cap, P/E, P/S, and EV/Sales on the Free plan. Pro adds 20+ valuation ratios and peer overlays.
Watchlist and portfolio tracking
Follow up to 8 stocks on a watchlist and 15 holdings in a portfolio, including dividend tracking.
Superinvestor 13F holdings
Browse reported quarterly holdings and portfolio activity from well-known institutional managers.
Earnings calendar and PNG exports
Track upcoming US earnings dates, export high-resolution chart PNGs, and build shareable stock tier lists.
How to research a stock
Start with what the business does, verify the 10-year financial trend in charts, and compare or model scenarios when a stock earns a closer look.
Search any US ticker
Open any of 5,000+ US-listed companies by ticker symbol or company name with no login required to browse.
Read the 10-K business summary
Start with a plain-English overview of how the company makes money, drawn from its latest SEC filings.
Check 10-year financial trends
Scan 8 interactive charts covering revenue growth, profit margins, free cash flow, debt, and share count.
New to fundamental analysis? Read the step-by-step stock research guide.
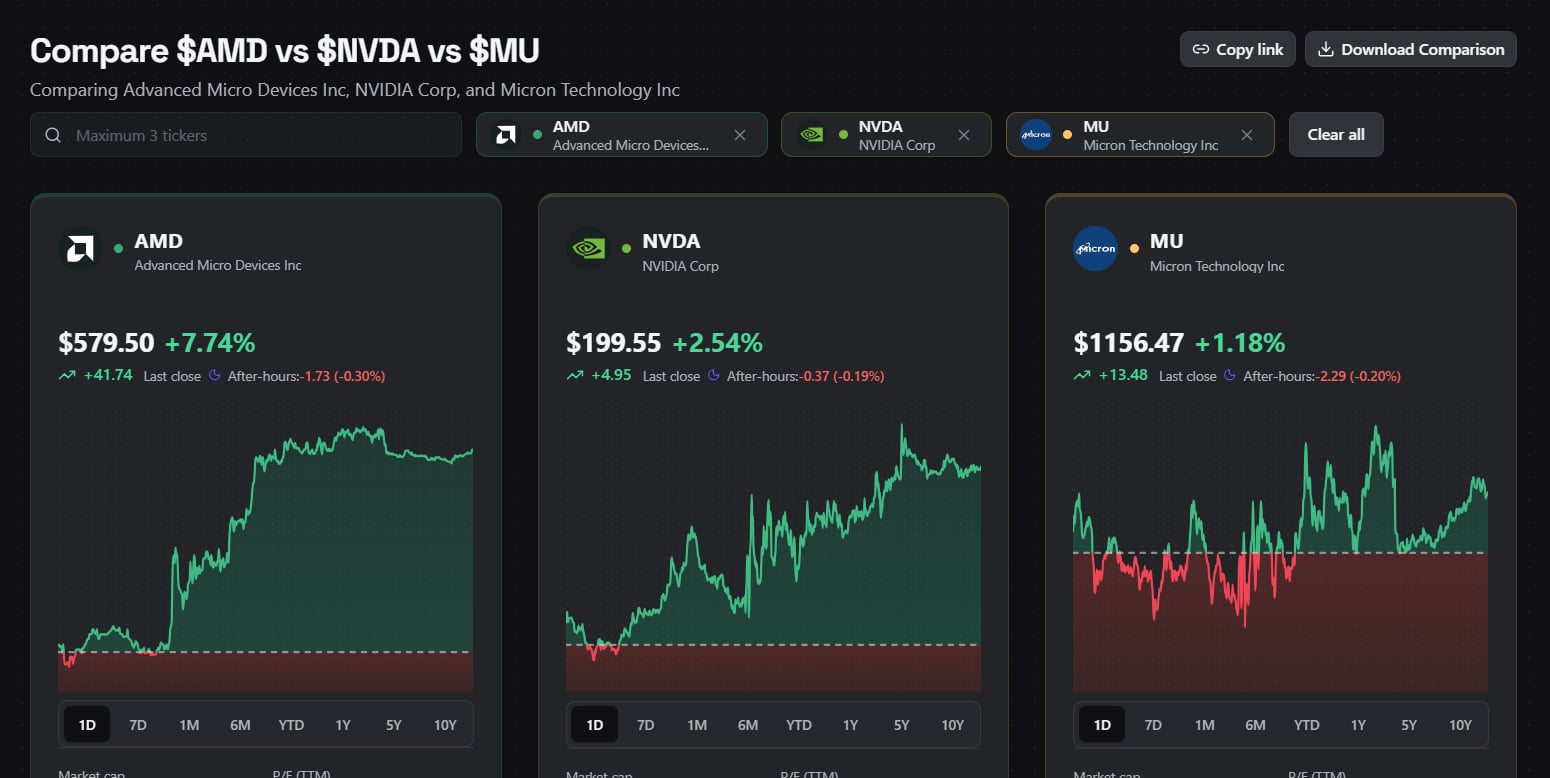
Compare up to 3 stocks
14-day Pro trialLine up competitors side by side on growth, margins, and valuation multiples. Visitors can preview one comparison free, with full access on the 14-day Pro trial.
Model bull, base, and bear cases
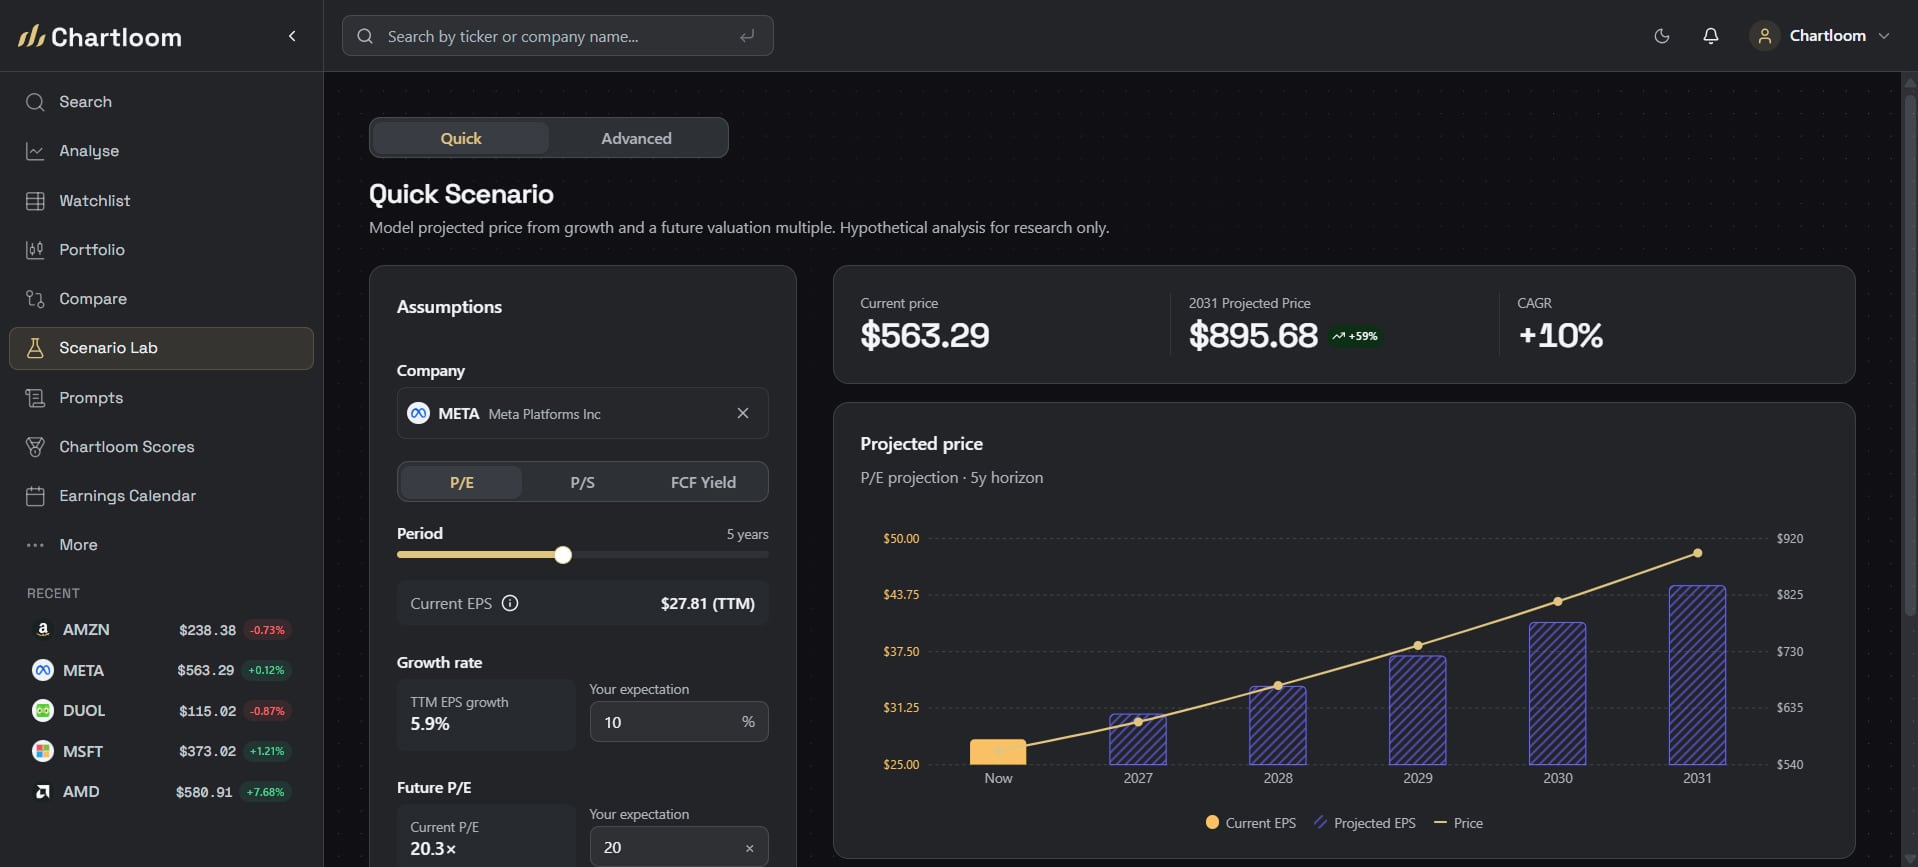
14-day Pro trialTest revenue growth, margin, and multiple assumptions in Scenario Lab, included on Pro and the 14-day trial.
Free vs Pro plans
Stay on the $0 Free plan as long as you like. Every new account also includes a 14-day Pro trial with no credit card required.
Free Plan · $0 forever
Built for self-directed investors who want 10-year financial charts, plain-English 10-K business overviews, and a focused watchlist without paying for a terminal.
Pro Plan · $10/month
Built for deeper thesis testing: 100+ charts per company, 35+ years of annual history, AI moat and risk analysis, 3-stock comparisons, Scenario Lab, and the full US stock screener.
| Capability | Free ($0) | Pro ($10/mo) |
|---|---|---|
| US stock coverage | 5,000+ | 5,000+ |
| Interactive charts per stock | 8 charts | 100+ charts |
| Annual financial history | 10 yrs on charts (2 yrs table) | 35+ years |
| Quarterly financial history | 8 quarters on charts | 15 years |
| Valuation multiples | Market cap, P/E, P/S, EV/Sales | 20+ |
| AI 10-K & 10-Q summaries | Business overview | Overview, moat & risks |
| Compare up to 3 stocks | Pro only | Included |
| Scenario Lab (bull/base/bear) | Pro only | Included |
| US stock screener | Limited preview | Filter 5,000+ stocks |
| Watchlists | 1 list, up to 8 stocks | 20 lists, 50+ metrics |
| Portfolio tracking | 1 portfolio, 15 holdings | Full tracking |
| Superinvestor 13F holdings | Included | Included |
| Monthly price | $0 | $10/mo |
Chartloom is built for long-term fundamental research on US-listed stocks (not day trading, options, or real-time tick data). See the full breakdown on pricing.
Frequently asked questions
Clear answers on what the Free plan includes, how the 14-day Pro trial works, and what data sources power Chartloom.
Is Chartloom really free?
Yes. The Free plan is $0 forever with no credit card required. It covers 5,000+ US stocks with 8 core financial charts per company, 10 years of annual chart history, 4 core valuation charts, and AI 10-K business overviews. New accounts also include a 14-day Pro trial with no card.
What is included on the Free plan?
Every free account includes 8 fundamental charts per company, 4 valuation charts (Market Cap, P/E, P/S, EV/Sales), plain-English AI business overviews, superinvestor 13F portfolios, the US earnings calendar, one watchlist (up to 8 stocks), one portfolio (up to 15 holdings), PNG chart exports, and shareable tier lists.
How does Chartloom compare to other free sites?
Traditional portals like Yahoo Finance focus on daily news and price quotes, while table-first sites show raw statement rows. Chartloom turns 10 years of annual financials and 8 quarters of trends into clean visual charts alongside plain-English 10-K overviews across 5,000+ US stocks.
How do I research a stock for free?
Start with how the business makes money, then check multi-year financial trends. Read the plain-English summary of the latest 10-K filing, chart revenue, operating margins, and free cash flow over 10 years, and check cash versus debt and share dilution.
Can I compare stocks side by side?
Visitors can preview one side-by-side comparison for free. Ongoing access to Stock Compare (up to 3 tickers with saved history) and multi-ticker chart overlays is included in the 14-day Pro trial and on the Pro plan.
Is Scenario Lab included on Free?
Scenario Lab for bull, base, and bear valuation modeling is part of the Pro plan ($10/month) and is included in the 14-day free Pro trial with no credit card required.
How much financial history is included?
The Free plan includes 10 years of annual chart history (2 years in statement tables) and 8 quarters of quarterly chart history. Pro extends coverage to 35+ years of annual data and 15 years of quarterly data.
What is Chartloom not built for?
Chartloom is built for long-term fundamental research on US-listed equities. It is not built for day trading, options chains, real-time tick data, or non-US stock exchanges.
Is this investment advice?
No. All charts, financial data, AI filing summaries, and scenario models on Chartloom are for informational and educational research only. Nothing on this site is financial, investment, tax, or legal advice.
Browse US stocks by ticker
Open any company below to inspect its Overview, Charts, Financials, and AI 10-K Summary on the Free plan. Filter by company name or ticker symbol.
Research any US stock for free
Open 5,000+ US stocks with 8 core financial charts and plain-English 10-K overviews. Every new account also includes a 14-day Pro trial.
$0 forever Free plan · 14-day Pro trial · No credit card required


