
AI summaries
Understand a 10-K in minutes, not a Sunday afternoon.
Plain-language business model, risk, and moat context — built for investors who cannot afford to miss red flags on smaller positions.
Read an AI summary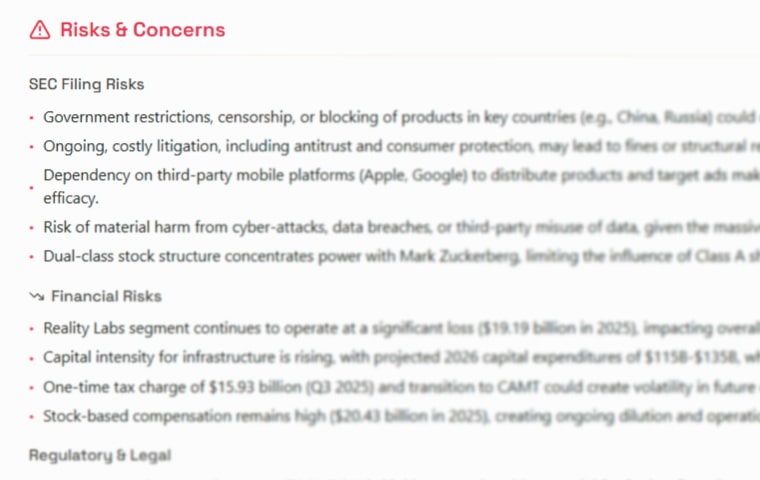
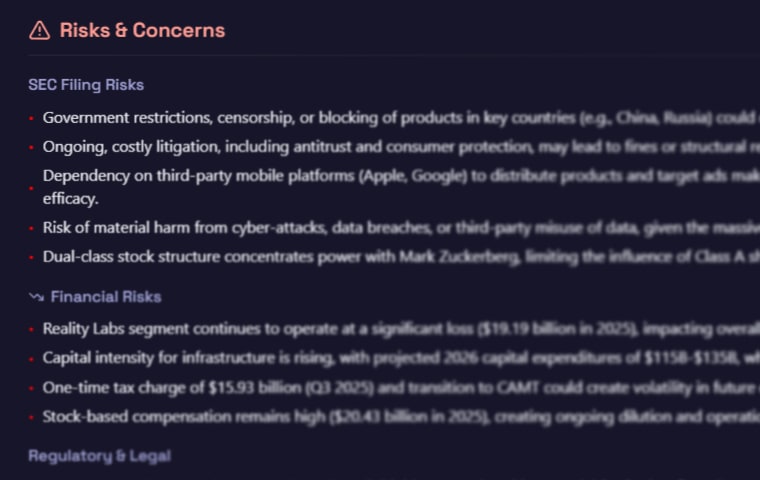
Professional research depth without the $30-50+/month terminal bill. Start free, or unlock Pro for $10/mo.
When every dollar in the portfolio counts, the research stack should too. Chartloom packs AI filing summaries, 100+ charts, portfolio tracking, and scenario modelling into one workspace priced for smaller accounts — with tickers you can explore before signing up.
Start 14-Day Free Trial · No credit card
Chartloom
Free or $10/mo
All features included · 14-day trial
Typical terminals
$29–80/mo
Often tier-gated or add-on priced
Research any ticker
No signup
Open charts & AI summaries instantly
Investors managing smaller portfolios often face a difficult trade-off: professional research tools cost $30 to $80/month, making them impractical when the subscription itself represents a meaningful percentage of annual returns.
Chartloom provides institutional-quality fundamental analysis - including AI-powered SEC summaries, 100+ interactive charts, and a Scenario Lab - at a price point that makes sense for portfolios of any size.
Four steps from first look to scenario modelling — each opens a live Chartloom surface, with or without an account.
Look up any US ticker for a single analyse view — business context, valuation, growth, and filing highlights without jumping between tabs.
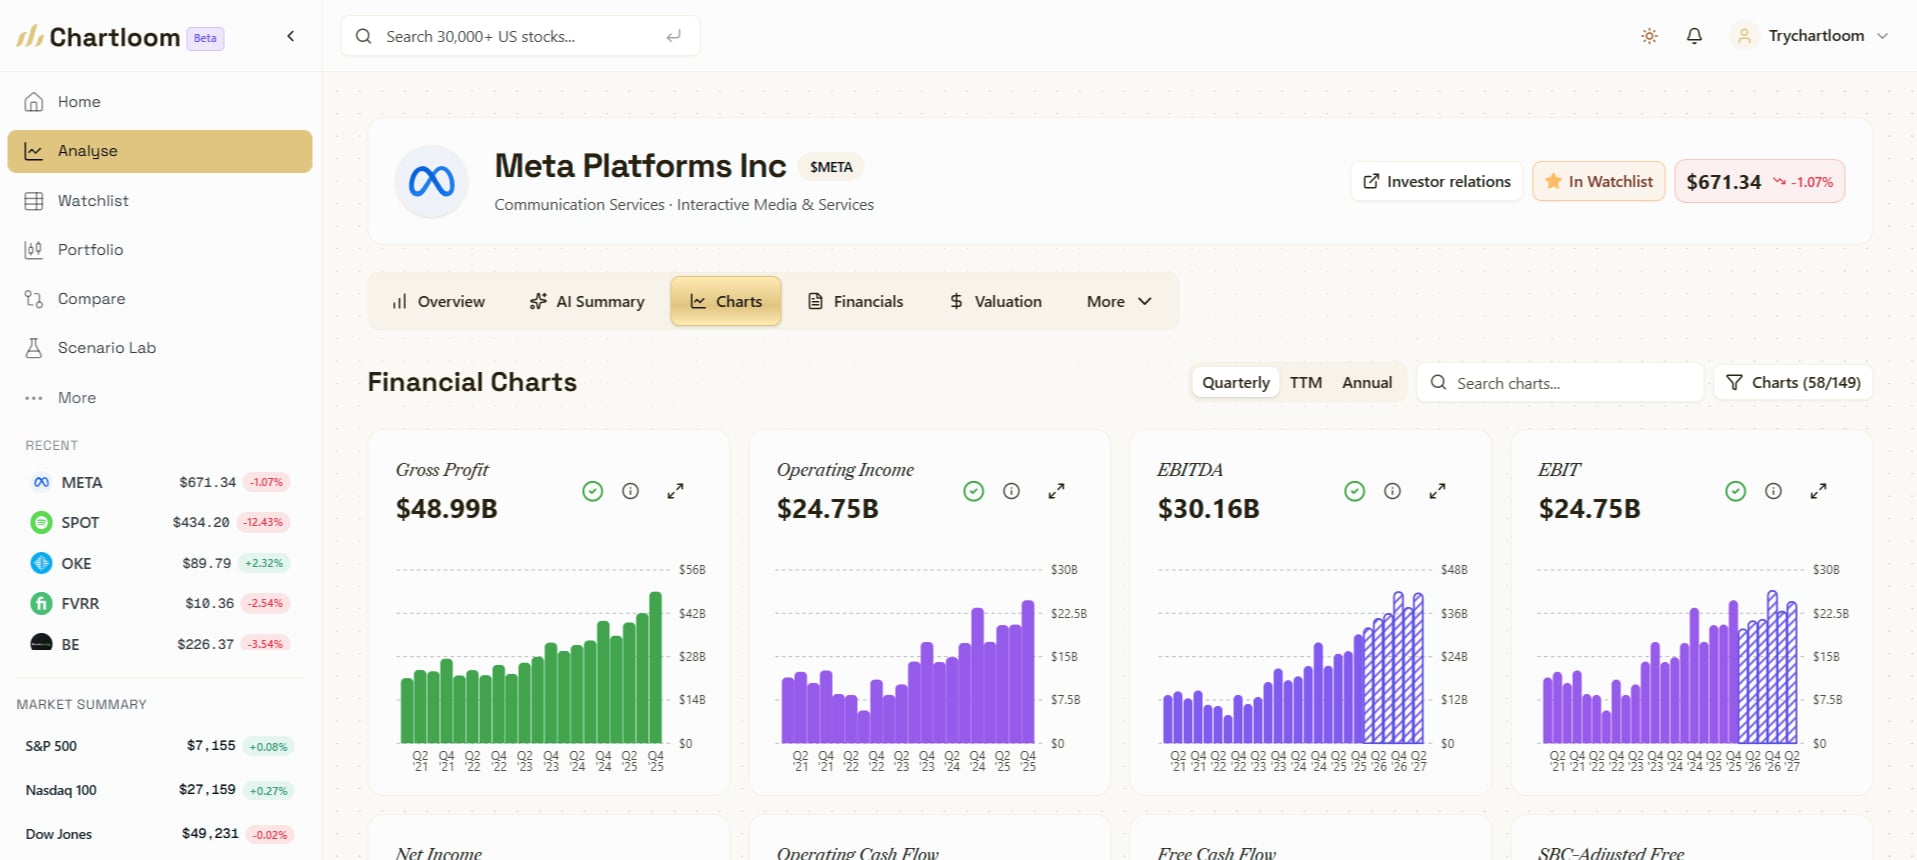
Open 100+ interactive charts across 35+ years — margins, multiples, cash flow, and growth trends built for spotting patterns on a smaller watchlist.
Line up to three names across 50+ metrics, then save standouts to a watchlist for ongoing monitoring.
Stress-test a thesis in Scenario Lab — adjust growth, margins, and multiples to see how bull, base, and bear assumptions may shift estimated fair value.
Open live Chartloom surfaces — research any US ticker without creating an account first.
AI summaries
Plain-language business model, risk, and moat context — built for investors who cannot afford to miss red flags on smaller positions.
Read an AI summaryPortfolio
Track what you own, yield on cost, and contribution pacing without maintaining parallel spreadsheets.
See portfolio tracking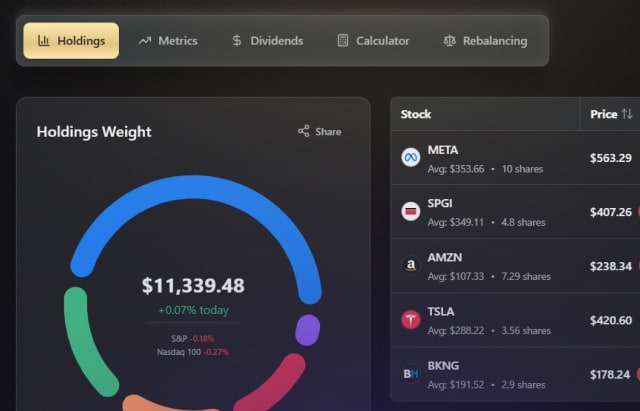
Charts
Valuation multiples, margins, and growth trends across 35+ years. Useful when comparing a handful of names deeply.
Open $META charts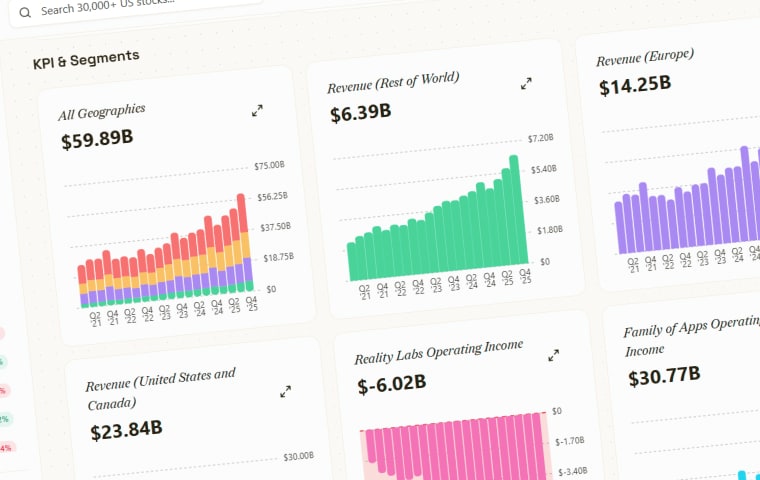
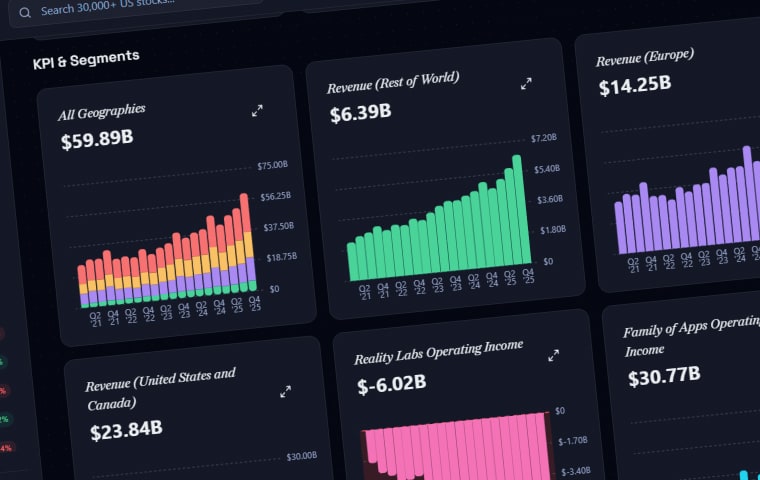
Professional-grade analysis at a fraction of the cost of comparable platforms. No feature gates - every plan gets full access.
Learn moreUnderstand 10-K and 10-Q filings in minutes, not hours. Essential when time-per-position matters more with smaller portfolios.
Learn moreStress-test investment theses with adjustable growth and earnings assumptions before committing capital.
Learn moreTrack holdings, dividend income, and dollar-cost averaging progress in one dashboard.
Learn moreModel how small, consistent contributions may grow over time with interactive scenario-based estimates.
Open compound calculatorValuation multiples, margin trends, growth rates, and more - exportable for sharing.
Learn moreExplore the same surfaces larger platforms gate behind $50/month plans — portfolio, scenarios, AI summaries, and 100+ charts.
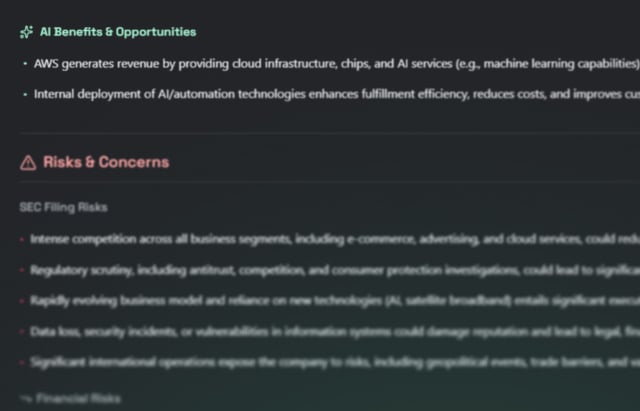
10-K & 10-Q filings distilled into concise summaries in seconds.
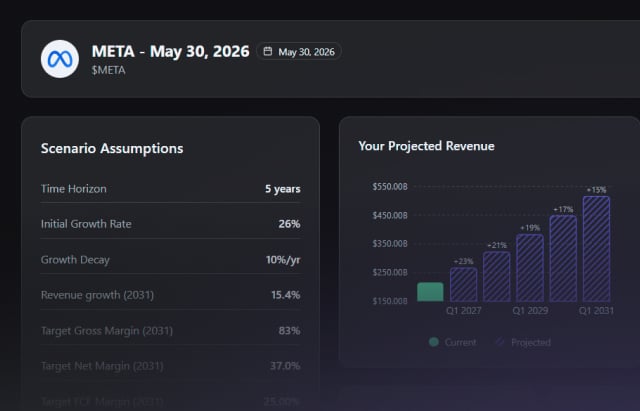
Stress-test company theses with adjustable assumptions and instant outcome updates.
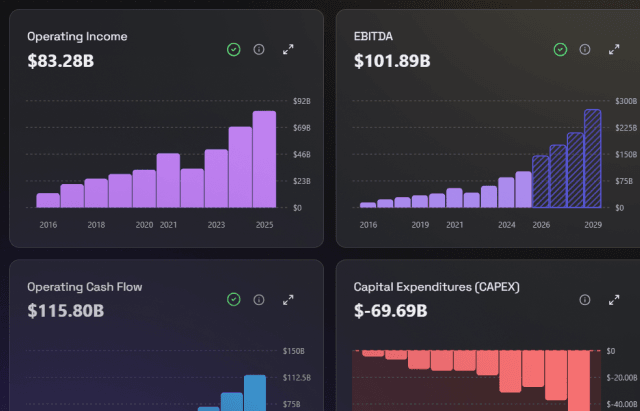
Visualise 35+ years of fundamentals. Export-ready for X, Substack, and LinkedIn.
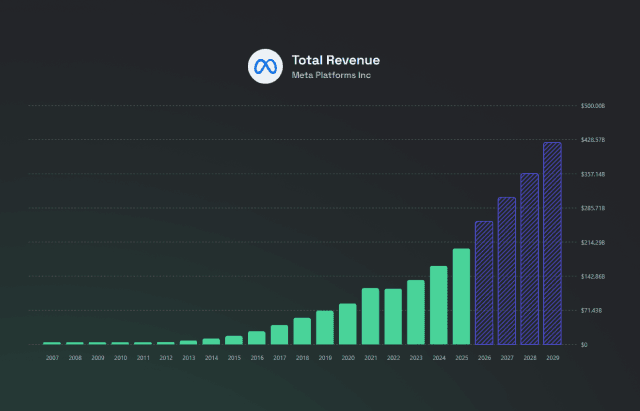
Study full business cycles. Most platforms limit data to 10 years.
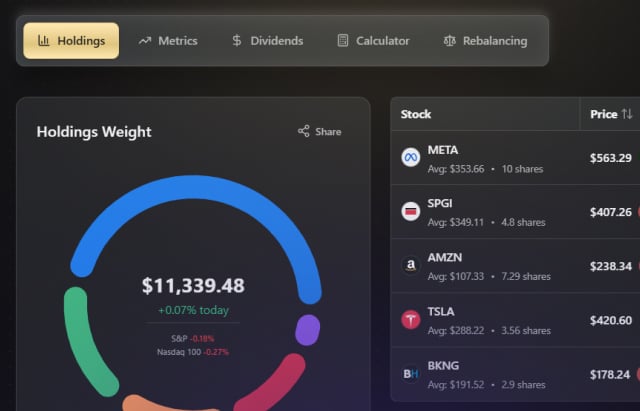
Track holdings, dividends, and dollar-cost averaging performance.
At $10/month, Chartloom costs less than a single trade commission on many platforms. We also offer a generous Free tier for those just getting started, making it an accessible entry point to professional-grade research for small portfolios. Compared to other tools charging $30-50+ per month, Chartloom Pro unlocks everything for just $10/mo.
Free Plan or $10/mo
14-day Pro trial · No credit card required
Open a ticker in Chartloom for fundamental charts, valuation context, and AI-assisted filing summaries—without leaving the research workflow.


