Stock Research for Fundamental Investors
Long-term financial data, valuation context, AI filing summaries, and scenario work help fundamental investors move from quick triage to deeper company analysis in one place.
Start 14-Day Free Trial
No credit card required
The Challenge
Fundamental investors need access to valuation ratios, margin trends, balance sheet strength, and long-term financial history. Many tools are either too shallow or priced for institutions, with limited scenario and comparison support.
How Chartloom Helps
Chartloom provides fundamental-focused research with 100+ interactive charts, valuation multiples, and 35+ years of data. The Scenario Lab supports stress-testing assumptions. AI summaries speed up filing review. Comparison tools and a custom dashboard help organise research across a universe of names.
Key Features for Fundamental Investors
100+ Interactive Charts
Valuation multiples, margin trends, growth rates, cash flow, and balance sheet metrics. Full history with hover detail and export.
Learn moreScenario Lab
Adjust growth, margin, and earnings assumptions to see how valuation and estimates change. Useful for testing downside and upside cases.
Learn moreAI SEC Summaries
10-K and 10-Q summaries covering business model, moat, and risk factors. Reduces time spent on initial filing review.
Learn moreKnowledge Base
50+ financial metrics with definitions, formulas, and examples. Reference for EV/EBITDA, ROIC, free cash flow, and more.
Company Comparison
Compare valuation, margins, growth, and financial health across multiple tickers. Build and save comparison sets.
Learn moreCustom Dashboard
Drag-and-drop layout for charts and metrics. Organise a fundamental research workspace around the metrics that matter most.
Learn moreWhy fundamental investors choose Chartloom
Valuation context, long-term data, AI filing summaries, and scenario analysis for deeper company research.
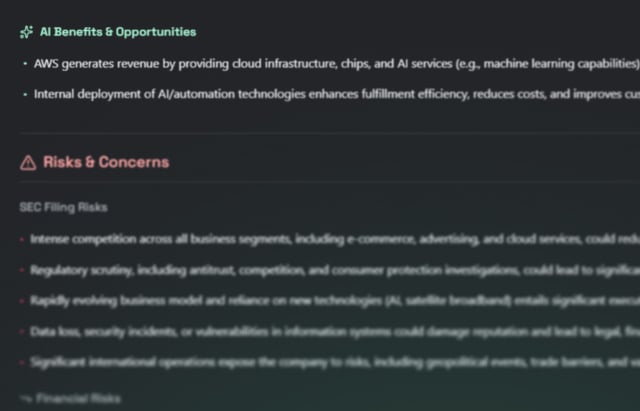
AI SEC Summaries
10-K & 10-Q filings distilled into concise summaries in seconds.
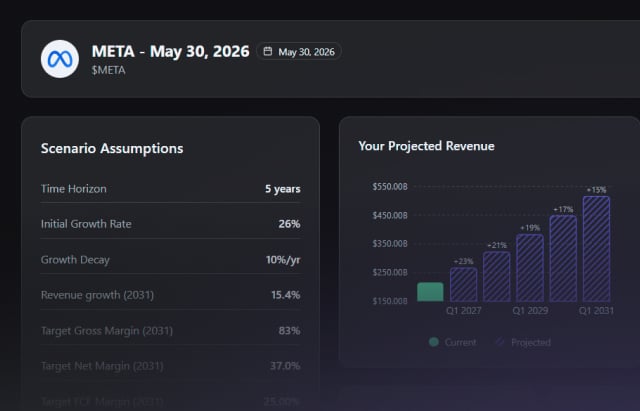
Scenario Lab
Stress-test company theses with adjustable assumptions and instant outcome updates.
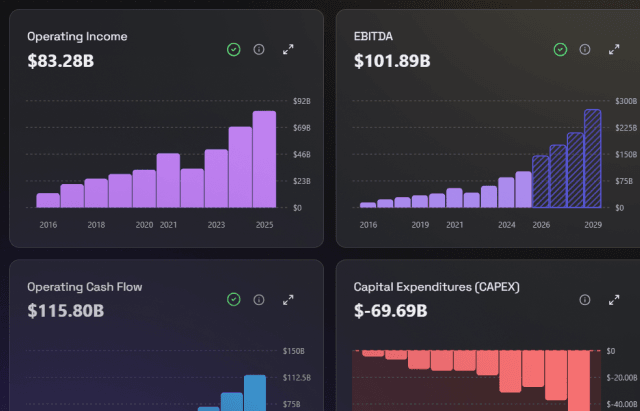
100+ interactive Charts
Visualise 35+ years of fundamentals. Export-ready for X, Substack, and LinkedIn.
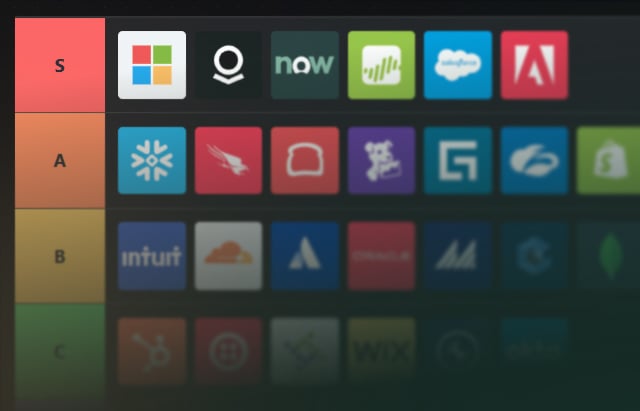
Shareable Tier Lists
Rank stocks by any metric and share your research with the community.
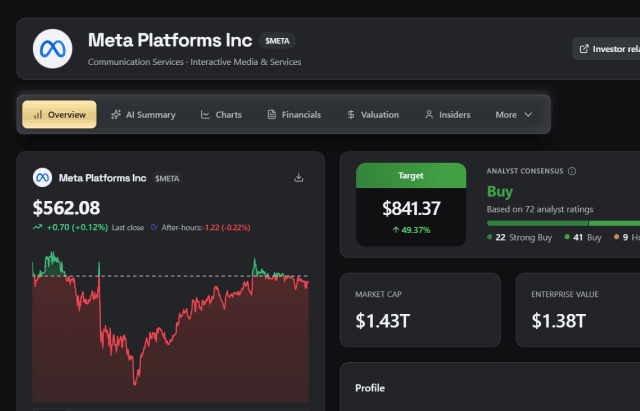
Customisable Dashboard
Drag-and-drop widgets make it easy to build a tailored research view.
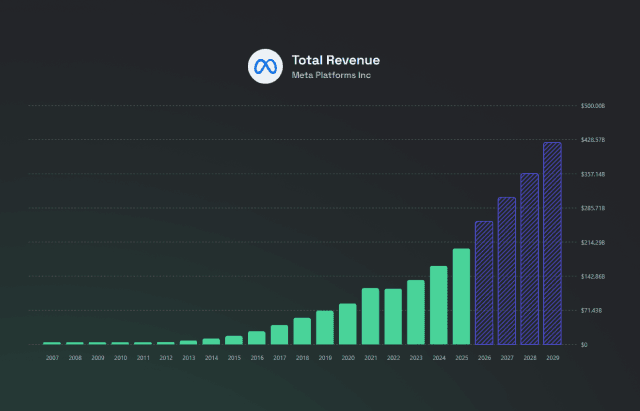
35+ Years of Data
Study full business cycles. Most platforms limit data to 10 years.
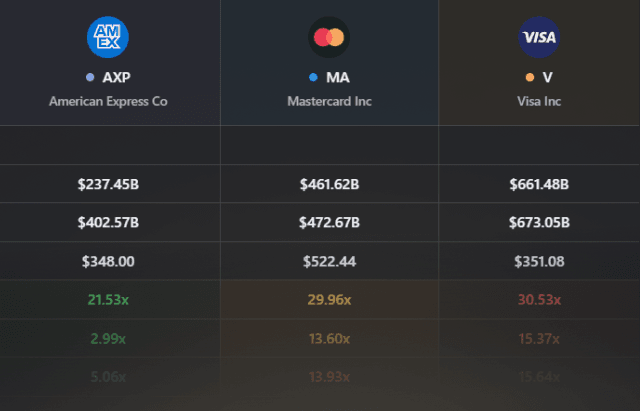
Compare 3 Stocks At Once
Side-by-side analysis across 50+ valuation metrics in one view.
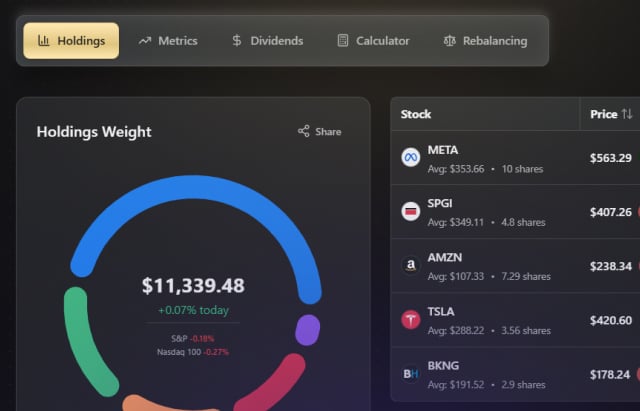
Portfolio & DCA Tracking
Track holdings, dividends, and dollar-cost averaging performance.
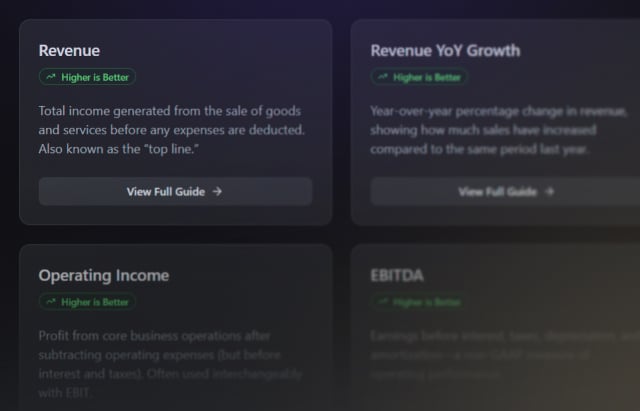
Knowledge Base
70+ financial metrics explained with real examples and context.
Affordable by Design
At $10/month with a 14-day free trial, Chartloom offers institutional-style fundamental data and tools at an accessible price. Fundamental investors may find it suitable for deep research and scenario work.
$10/mo
Free trial included; all features unlocked
Frequently Asked Questions
Chartloom includes P/E, EV/EBITDA, EV/Sales, P/S, P/B, and other valuation multiples with historical context. Metrics are defined in the Knowledge Base.
Chartloom provides 35+ years of financial data for many metrics and charts. Useful for long-term fundamental analysis and trend work.
Yes. The Scenario Lab lets investors adjust revenue growth, margins, and earnings assumptions and see how valuation and estimates update.
Chartloom is designed for fundamental research: 100+ charts, long-term data, Scenario Lab, AI filing summaries, and comparison tools. Investors may use it as a primary research platform or alongside other tools.
Related
Start Researching Today
AI-powered SEC summaries, 100+ interactive charts, and the Scenario Lab. Free trial; no credit card required.