Understand Stocks Without the Jargon
Plain-English company summaries, guided chart explanations, and simple terminology help new investors understand what matters first and what to research next.
Start 14-Day Free Trial
No credit card required
The Challenge
Company reports and stock screens are full of numbers and terms that feel like a foreign language. It is easy to feel lost, unsure what to look at first or what any of it means. Many tools assume you already know the basics.
How Chartloom Helps
Chartloom turns that confusion into clarity. Company reports become short, plain-English summaries so you see what a business does and what could go wrong. Every chart and number comes with a simple explanation. You go from “I don’t get it†to “I get the big picture.â€
Key Features for Beginners
Plain-English Company Summaries
Long reports are boiled down to the main points: what the company does, what makes it strong, and what could go wrong. No need to read hundreds of pages to get up to speed.
Learn moreSimple Glossary & Explanations
Every important term is explained in plain language with examples. Look up anything you see on a chart or in a summary and learn as you go.
Help on Every Chart
Each chart and metric has a short explanation of what it shows and why it matters. You can learn from the data instead of searching elsewhere.
Charts That Show the Story
See trends and compare companies with clear visuals. No spreadsheets needed: hover, zoom, and explore. Spot what’s improving or getting worse at a glance.
Learn moreTier Lists & Watchlists
Rank and organise stocks you are researching. Keep track of what you like and compare your ideas in one place.
Learn moreCompound Interest Calculator
See how saving or investing regularly can grow over time. A simple way to picture the effect of staying invested for the long run.
Learn moreWhy beginner investors choose Chartloom
Plain-English summaries, guided chart explanations, and a research workflow designed to reduce early overwhelm.
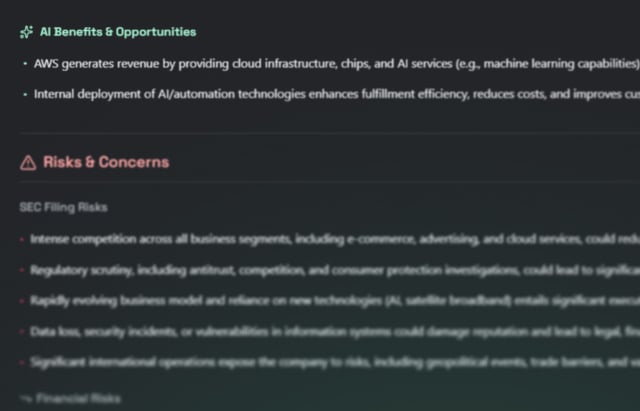
AI SEC Summaries
10-K & 10-Q filings distilled into concise summaries in seconds.
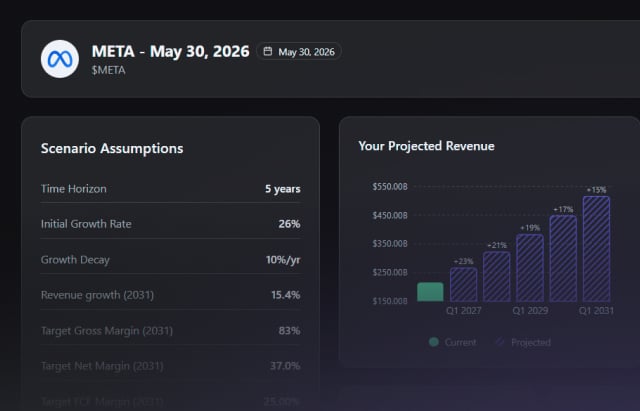
Scenario Lab
Stress-test company theses with adjustable assumptions and instant outcome updates.
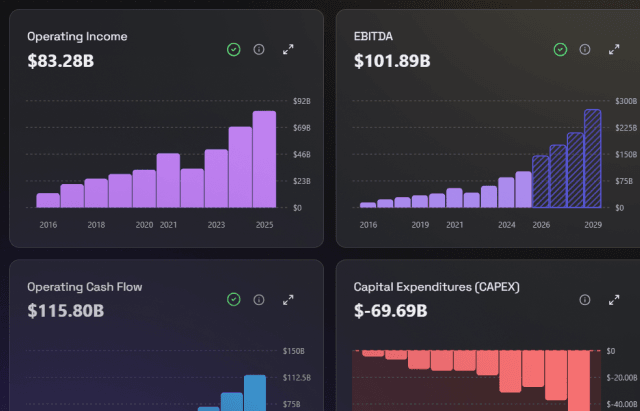
100+ interactive Charts
Visualise 35+ years of fundamentals. Export-ready for X, Substack, and LinkedIn.
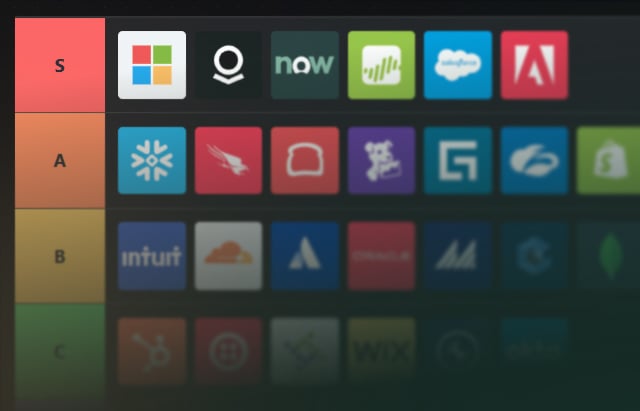
Shareable Tier Lists
Rank stocks by any metric and share your research with the community.
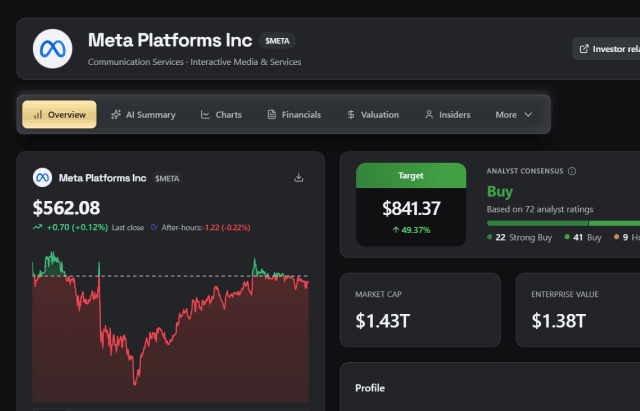
Customisable Dashboard
Drag-and-drop widgets make it easy to build a tailored research view.
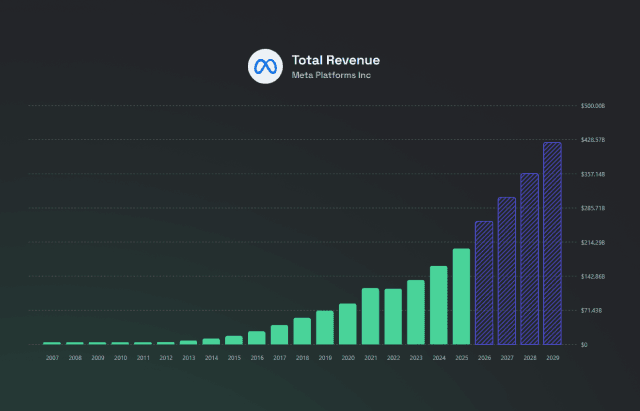
35+ Years of Data
Study full business cycles. Most platforms limit data to 10 years.
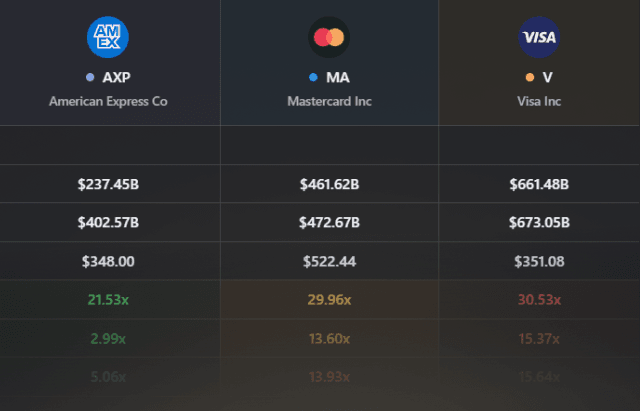
Compare 3 Stocks At Once
Side-by-side analysis across 50+ valuation metrics in one view.
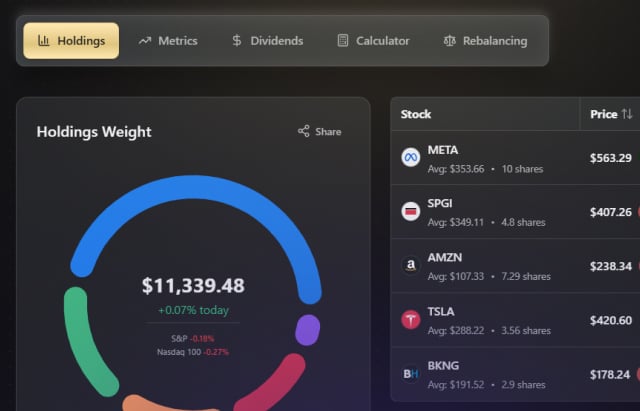
Portfolio & DCA Tracking
Track holdings, dividends, and dollar-cost averaging performance.
Knowledge Base
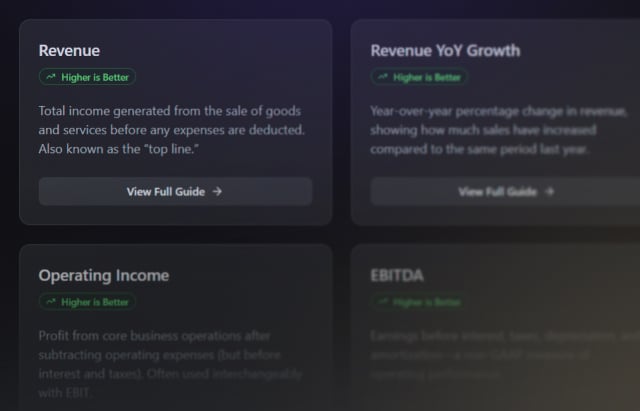
70+ financial metrics explained with real examples and context.
Affordable by Design
Chartloom is $10/month with a 14-day free trial and no credit card required. New investors may find it an affordable way to learn and research without the overwhelm.
$10/mo
Free trial included; all features unlocked
Frequently Asked Questions
Yes. Chartloom is built for people learning the basics. Company summaries are in plain English, every term can be looked up, and each chart has short explanations so you can understand what you are looking at.
No. Chartloom explains things as you go. Summaries describe what a company does and what to watch out for. Charts show the numbers with clear labels and help text so you can learn while you research.
Start with the company summary to get the big picture. Then look at the main charts (revenue, profits, and cash flow) and use the built-in explanations to understand what they mean. The glossary is there whenever a term is unfamiliar.
Yes. A 14-day free trial is available with no credit card required. All features are included so you can see if it fits how you like to research.
Related
Start Researching Today
AI-powered SEC summaries, 100+ interactive charts, and the Scenario Lab. Free trial; no credit card required.