Stock Research for Dividend Investors
Yield, payout coverage, free cash flow, and long-term portfolio income can be reviewed together, so dividend research is easier to keep disciplined and repeatable.
Start 14-Day Free Trial
No credit card required
The Challenge
Dividend investors need to evaluate not only current yield but sustainability: payout ratios, free cash flow coverage, earnings stability, and debt. Piecing this together from filings and spreadsheets is time-consuming.
How Chartloom Helps
Chartloom surfaces the metrics that matter for dividend analysis. Free cash flow, payout ratios, and earnings trends are available in interactive charts. The portfolio module tracks dividend income and yield on cost. AI SEC summaries add context on capital allocation and risk.
Key Features for Dividends
Dividend Portfolio Tracking
Track dividend income, yield on cost, and payment schedules across holdings. Monitor income and upcoming payments in one place.
Financial Statement Charts
Visualise free cash flow, payout ratios, and earnings trends over 35+ years. Assess whether dividends are well covered and sustainable.
AI SEC Summaries
Understand risk factors, capital allocation strategy, and competitive position. Useful for evaluating management’s approach to dividends and buybacks.
Valuation & Yield Metrics
Dividend yield, payout ratio, and valuation multiples at a glance. Compare yield and sustainability across income-focused names.
Company Comparison
Compare dividend-related metrics and financial health across multiple tickers. Helps screen for sustainable payers.
Long-Term Data
35+ years of financial data for assessing dividend growth and consistency through different market cycles.
Why dividend investors choose Chartloom
Payout sustainability, income tracking, and long-term cash flow context in one research workflow.
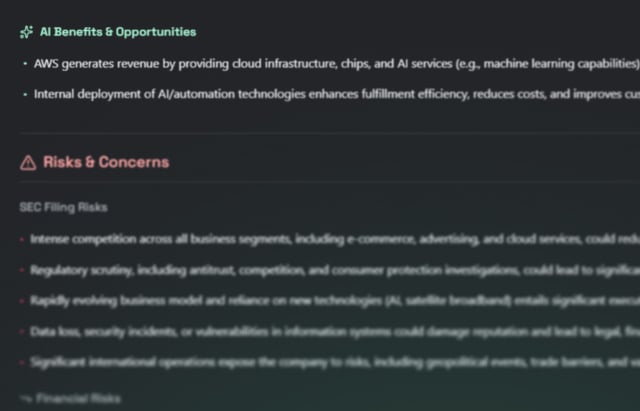
AI SEC Summaries
10-K & 10-Q filings distilled into concise summaries in seconds.
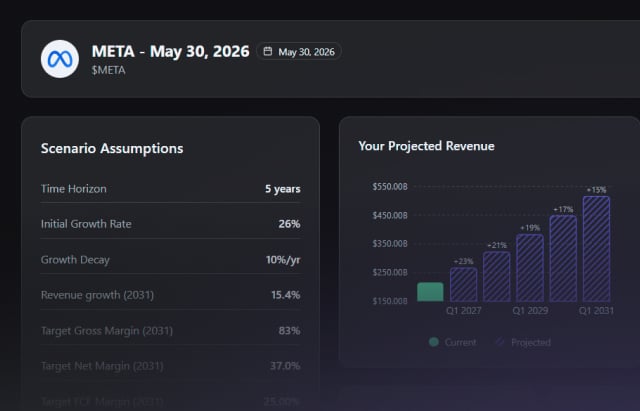
Scenario Lab
Stress-test company theses with adjustable assumptions and instant outcome updates.
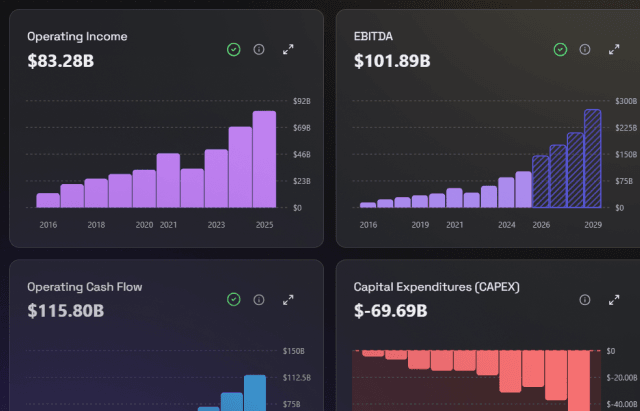
100+ interactive Charts
Visualise 35+ years of fundamentals. Export-ready for X, Substack, and LinkedIn.
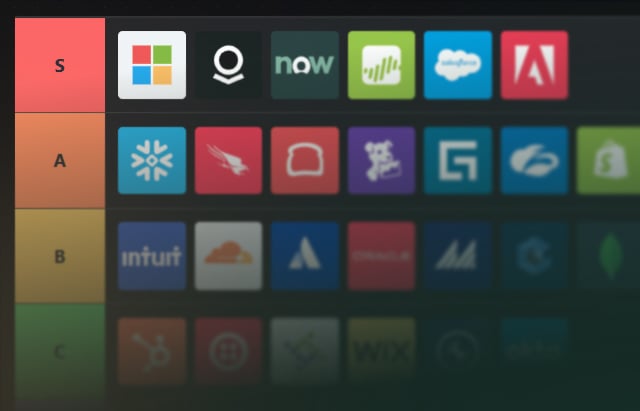
Shareable Tier Lists
Rank stocks by any metric and share your research with the community.
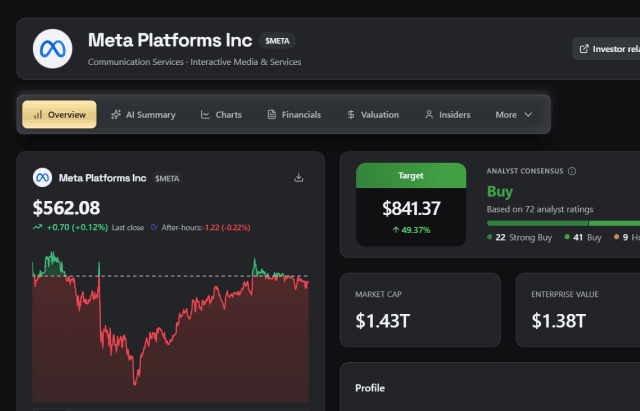
Customisable Dashboard
Drag-and-drop widgets make it easy to build a tailored research view.
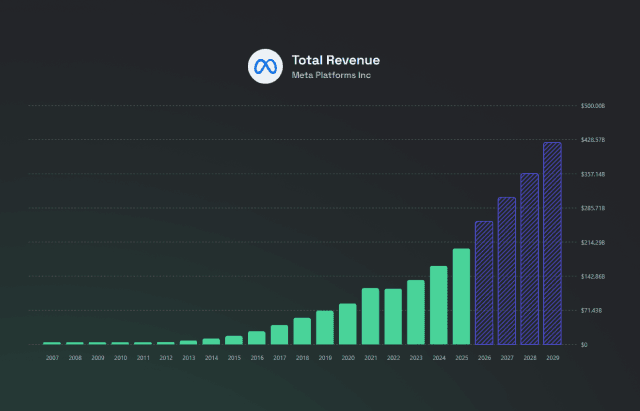
35+ Years of Data
Study full business cycles. Most platforms limit data to 10 years.
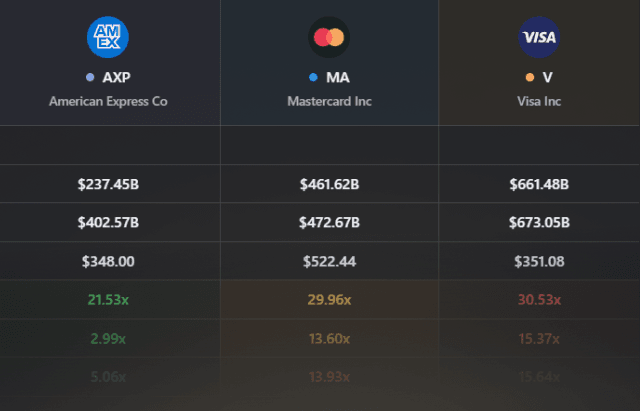
Compare 3 Stocks At Once
Side-by-side analysis across 50+ valuation metrics in one view.
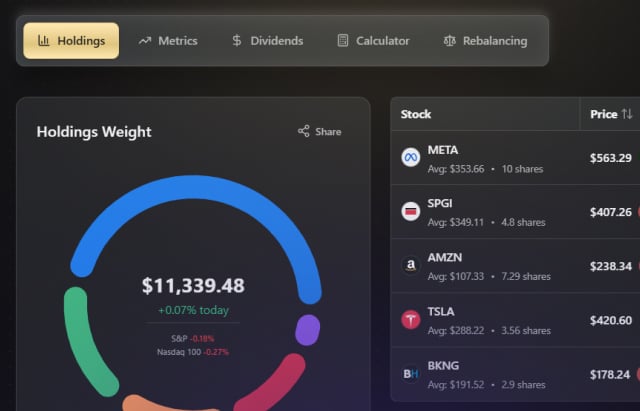
Portfolio & DCA Tracking
Track holdings, dividends, and dollar-cost averaging performance.
Knowledge Base
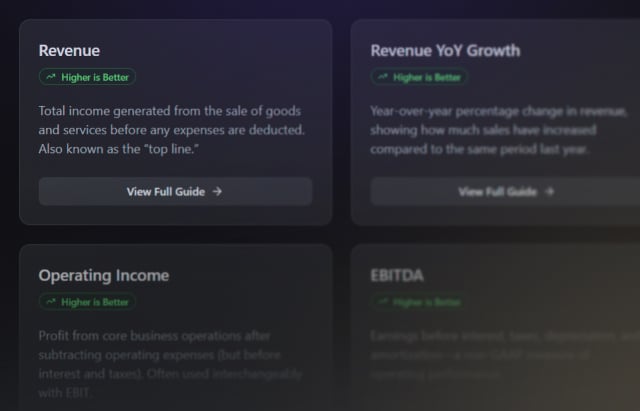
70+ financial metrics explained with real examples and context.
Affordable by Design
Chartloom is $10/month with a 14-day free trial. Dividend investors may find the combination of payout and cash flow charts plus portfolio tracking useful for researching and monitoring income holdings.
$10/mo
Free trial included; all features unlocked
Frequently Asked Questions
Yes. The portfolio module tracks dividend income, yield on cost, and payment schedules. Investors can monitor income and upcoming payments across holdings.
Yes. Chartloom includes charts for payout ratios, free cash flow, and earnings over many years. Investors may use these to assess dividend sustainability.
Chartloom provides long-term financial data and charts that support research into dividend growth and consistency. AI summaries add context on capital allocation and risk.
Yes. The comparison tool lets investors view dividend-related metrics and financial health side by side across multiple tickers.
Related
Start Researching Today
AI-powered SEC summaries, 100+ interactive charts, and the Scenario Lab. Free trial; no credit card required.